696
Views
2
CrossRef citations to date
0
Altmetric
Research Article

Inhibition of mammalian aspartate transcarbamylase by quinazolinone derivatives

, , &
Pages 483-492 | Received 03 Jun 2007, Accepted 11 Aug 2007, Published online: 04 Oct 2008

Figures & data

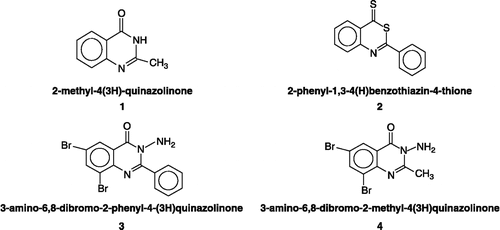
Figure 1 The quinazolinone derivatives 1, 2, 3 and 4 tested for the inhibition of ATCase.

Figure 1 The quinazolinone derivatives 1, 2, 3 and 4 tested for the inhibition of ATCase.

Figure 2 In vitro inhibition of ATCase by quinazolinone derivatives. (A): compounds 1 (left panel) and 2 (right panel). (B): compounds 3 (left panel) and 4 (right panel). The relative activity is the activity % of control and assays were carried out at pH 8.2 and 30°C.
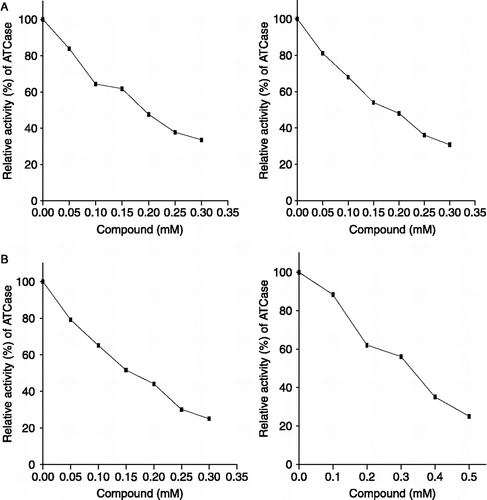
Figure 2 In vitro inhibition of ATCase by quinazolinone derivatives. (A): compounds 1 (left panel) and 2 (right panel). (B): compounds 3 (left panel) and 4 (right panel). The relative activity is the activity % of control and assays were carried out at pH 8.2 and 30°C.

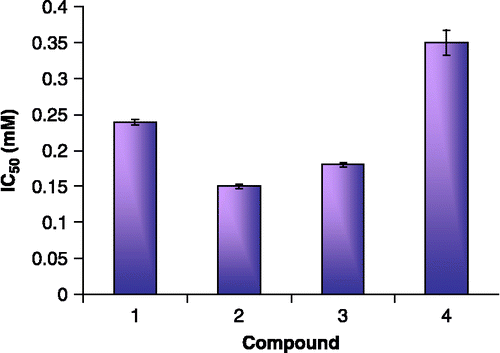
Figure 3 IC50 of the tested quinazolinone derivatives 1, 2, 3 and 4 for ATCase inhibition.

Figure 3 IC50 of the tested quinazolinone derivatives 1, 2, 3 and 4 for ATCase inhibition.

Table I.  The reversibility of the binding of compounds 2 and 3 to ATCase. The enzyme was incubated in vitro with each compound for 60 min followed by dialysis for 12 h at pH 7.4. ATCase activity was then measured for the treated enzyme at 30°C and compared to control.

Figure 4 Lineweaver Burk plots of ATCase. The enzyme is assayed in the absence and presence of compound 2 (A and B) or compound 3 (C and D) at varying concentrations of Asp (A and C) and CP (B and D).
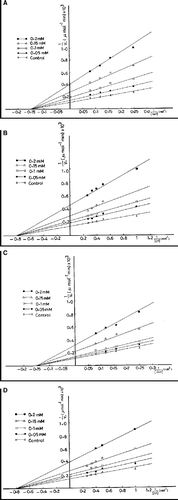
Figure 4 Lineweaver Burk plots of ATCase. The enzyme is assayed in the absence and presence of compound 2 (A and B) or compound 3 (C and D) at varying concentrations of Asp (A and C) and CP (B and D).

Figure 5 Dixon plots of ATCase inhibition. The enzyme is assayed at varying concentrations of CP in presence of different concentrations of compound 2 (upper panel, left) and 3 (upper panel, right) and varying concentrations of Asp in presence of different concentrations of compound 2 (lower panel, left) and 3 (lower panel, right).
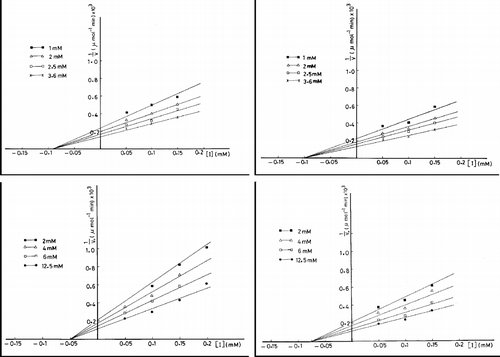
Figure 5 Dixon plots of ATCase inhibition. The enzyme is assayed at varying concentrations of CP in presence of different concentrations of compound 2 (upper panel, left) and 3 (upper panel, right) and varying concentrations of Asp in presence of different concentrations of compound 2 (lower panel, left) and 3 (lower panel, right).

Table II.  Specific activities of in vivo treatment of ATCase by quinazolinone derivatives (compounds 14). Mice were treated with the specified dose twice for two days, sacrificed and their livers were removed and prepared for the enzyme assay. The vehicle-treated group (control) was treated with corn oil. Assays were carried out at pH 8.2 at 30°C. Values of specific activity are expressed as mean±standard error (SE).
Reprints and Corporate Permissions

Please note: Selecting permissions does not provide access to the full text of the article, please see our help page How do I view content?

To request a reprint or corporate permissions for this article, please click on the relevant link below:

Academic Permissions

Please note: Selecting permissions does not provide access to the full text of the article, please see our help page How do I view content?

Obtain permissions instantly via Rightslink by clicking on the button below:

If you are unable to obtain permissions via Rightslink, please complete and submit this Permissions form. For more information, please visit our Permissions help page.