Figures & data
Figure 1. (a) Growth curve of NCEB1 cell line with various cell densities as assessed by the AB reagent over a time course of 72 h after AB addition. Cells were seeded into 384-well microtiter plates. An average of 48 wells was used for each data point. (b) Effect of DMSO on the growth of NCEB1 cell line as assessed by the AB reagent over a time course of 48 h. Cells were seeded into 384-well microtiter plates. An average of 96 wells was used for each data point. (c) Assessment of assay performance and robustness. Cells were seeded into 384-well microtiter plates and incubated for 36 h prior to addition of the AB reagent. High control wells contained 1% DMSO (v/v). Low control wells contained 25 μM staurosporine in 1% DMSO (v/v).
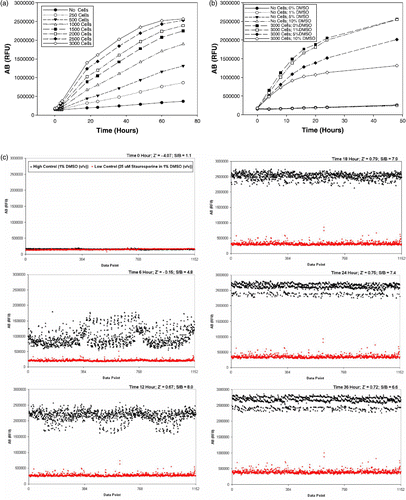
Figure 2. Effects of known cytotoxic agents on the growth of the NCEB1 cell line as assessed by the AB reagent over a time course of 36 h. Cells were seeded into 384-well microtiter plates and incubated for 36 h prior to the addition of the AB reagent. Negative control wells contained no cells. Positive control wells contained 1% DMSO (v/v). All drugs were screened at a 10 μM final concentration in 1% DMSO (v/v). An average of 48 wells was used for each data point.
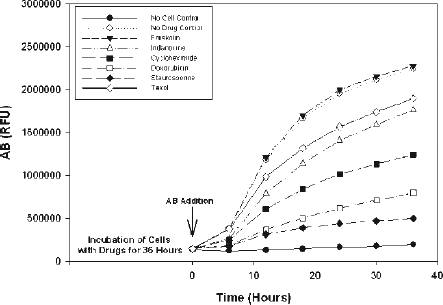
Figure 3. Assay miniaturization in 1536-well microtiter plate. Cells were seeded into 1536-well microtiter plates and incubated for 36 h prior to the addition of the AB reagent and further incubated for 24 h prior to reading the AB fluorescence. High control wells contained 1% DMSO (v/v). Low control wells contained 25 μM staurosporine in 1% DMSO (v/v).
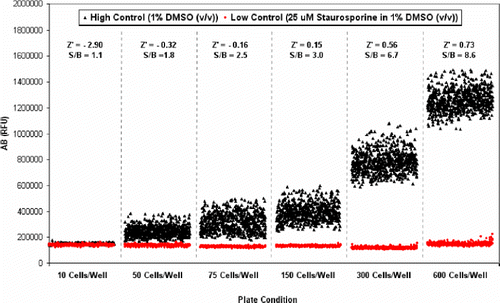
Figure 4. Control experiment to evaluate assay robustness and performance in 1536-well microtiter format. Top panel shows heat map analysis of the high and low control plate. Bottom panel shows AB signal and distribution of high and low control points. High control wells contained 1% DMSO (v/v). Low control wells contained 25 μM staurosporine in 1% DMSO (v/v).
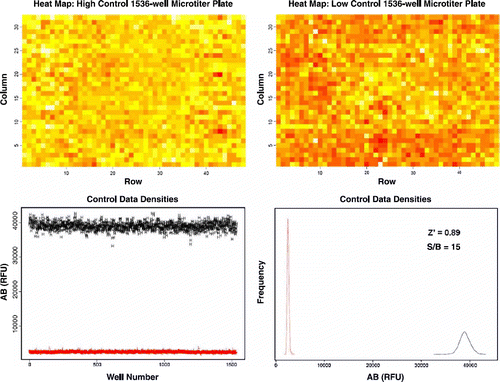
Figure 5. Sample images of 384-well microtiter plate and 1536-well microtiter plate as imaged by the LEADseeker™ Multimodality Imaging System.
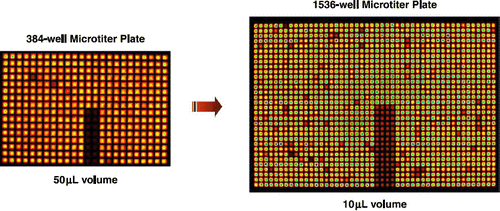
Figure 6. Scatter plot of 2000 compound validation of the NCEB1 cell line. Scatter plot shows percent inhibition of duplicate values for each compound.
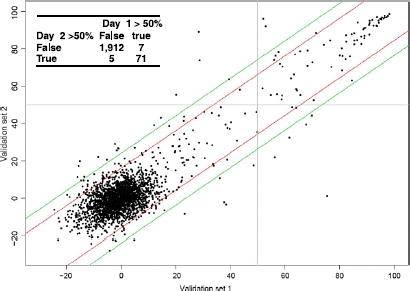
Table I. Comparison of IC50 values in both 384-well microtiter plate and 1536-well microtiter plate. NCEB1 cells were seeded into 384-well microtiter plates and 1536-well microtiter plates and incubated with drugs for 48 h prior to addition of AB reagent. Cells were then incubated for another 24 h with AB reagent before readings were taken. High control wells contained 1% DMSO (v/v). Low control wells contained 25μM staurosporine in 1% DMSO (v/v).
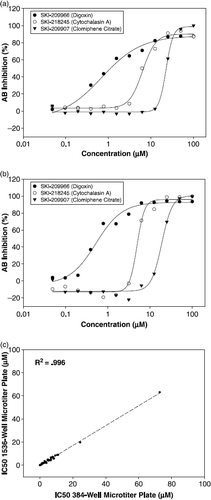
Figure 7. (a) IC50 curves of each compound in 384-well microplate format: Digoxin, 0.8 μM; Cytochalasin A, 8.5 μM; and Clomiphene Citrate, 24.5 μM. (b) IC50 curves of each compound in 1536-well microplate format: Digoxin, 0.6 μM; Cytochalasin A, 5.8 μM; and Clomiphene Citrate, 19.8 μM. (c) Correlation plot of IC50 values in 384-well microtiter plate versus 1536-well microtiter plate. NCEB1 cells were incubated with compounds for 48 h and then incubated with AB reagent for another 24 h. High control wells contained 1% DMSO (v/v). Low control wells contained 25 μM staurosporine in 1% DMSO (v/v). IC50 values are an average of two independently fitted dose response curves for each data set.