1,462
Views
38
CrossRef citations to date
0
Altmetric
Research Article

Inhibitory effects on mushroom tyrosinase by flavones from the stem barks of Morus lhou (S.) Koidz

, , , , &
Pages 922-930 | Received 14 Jul 2007, Accepted 19 Sep 2007, Published online: 20 Oct 2008

Figures & data

Figure 1. Chemical structures of isolated compounds 1-5 in stem barks of M. lhou. Arrows indicate HMBC correlations.
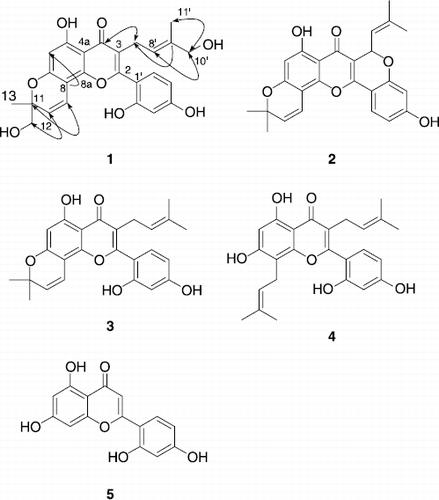
Figure 1.  Chemical structures of isolated compounds 1-5 in stem barks of M. lhou. Arrows indicate HMBC correlations.

Table I. Inhibitory effects of isolated compounds 1-5 on mushroom tyrosinase activities.

Figure 2. Effect of compounds (1, 2, 4, and 5) on the activity of tyrosinase for the catalysis of l–tyrosine at 30 °C.
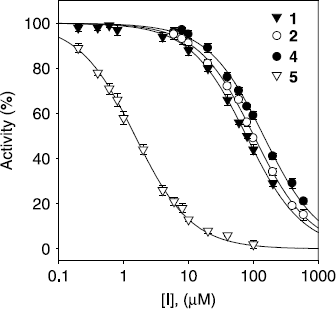
Figure 2.  Effect of compounds (1, 2, 4, and 5) on the activity of tyrosinase for the catalysis of l–tyrosine at 30 °C.

Figure 3. Relationship of the catalytic activity of mushroom tyrosinase with the enzyme concentrations at different concentrations of compound 4. Concentrations of compound 4 for curves 0-4 were, 0, 40, 80, 120, and 160 μM, respectively.
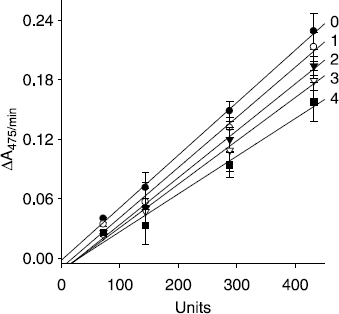
Figure 3.  Relationship of the catalytic activity of mushroom tyrosinase with the enzyme concentrations at different concentrations of compound 4. Concentrations of compound 4 for curves 0-4 were, 0, 40, 80, 120, and 160 μM, respectively.

Figure 4. Time course of oxidation of l–tyrosine catalyzed by mushroom tyrosinase in the presence of compounds (1-5) for curves. Conditions were as follows: 180 μM tyrosine, 0.25 M phosphate buffer, pH 6.8, not preincubated at 30 °C. (A) Concentrations of compounds 1, 2, and 4 were 80 μM, 50 μM, and 100 μM. (B) Concentrations of compounds 3 and 5 were 100 μM and 25 nM, respectively.
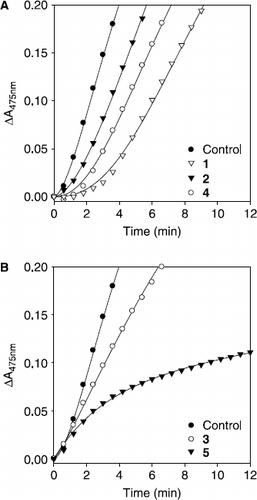
Figure 4.  Time course of oxidation of l–tyrosine catalyzed by mushroom tyrosinase in the presence of compounds (1-5) for curves. Conditions were as follows: 180 μM tyrosine, 0.25 M phosphate buffer, pH 6.8, not preincubated at 30 °C. (A) Concentrations of compounds 1, 2, and 4 were 80 μM, 50 μM, and 100 μM. (B) Concentrations of compounds 3 and 5 were 100 μM and 25 nM, respectively.

Figure 5. Lineweaver-Burk plots for inhibition of compounds 1, 2, 4, and 5 on mushroom tyrosinase for the catalysis of l–tyrosine. Conditions were as follows: 180 μM l–tyrosine, 144 units tyrosinase, 0.25 M phosphate buffer (pH 6.8), at 30 °C. In the presence of different concentrations of compounds for curves from bottom to top were, (A) for compound 1: 0, 60, and 160 μM; (B) for compound 2: 0, 41.7, 83.3, and 166.7 μM; (C) for compound 4: 0, 83.3, 166.7, and 250 μM; (D) for compound 5: 0, 0.6, 1.2, and 2.4 μM.
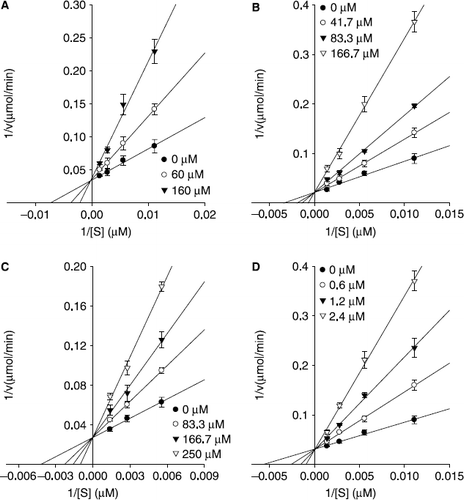
Figure 5.  Lineweaver-Burk plots for inhibition of compounds 1, 2, 4, and 5 on mushroom tyrosinase for the catalysis of l–tyrosine. Conditions were as follows: 180 μM l–tyrosine, 144 units tyrosinase, 0.25 M phosphate buffer (pH 6.8), at 30 °C. In the presence of different concentrations of compounds for curves from bottom to top were, (A) for compound 1: 0, 60, and 160 μM; (B) for compound 2: 0, 41.7, 83.3, and 166.7 μM; (C) for compound 4: 0, 83.3, 166.7, and 250 μM; (D) for compound 5: 0, 0.6, 1.2, and 2.4 μM.

Figure 6. Time-dependent inhibition of tyrosinase in the presence of norartocarpetin (5). (A) Conditions were as follows: 180 μM l–tyrosine, 144 units tyrosinase, and concentrations of norartocarpetin for curves from top to bottom were 0, 9.76, 19.53, 39.06, and 78.12 nM. The kobs values at each inhibition concentration were determined by fitting the data to Equation (2). (B) Dependence of the values for kobs on the concentration of norartocarpetin. The kobs values, determined in panel A, were fitted to Equation (3).
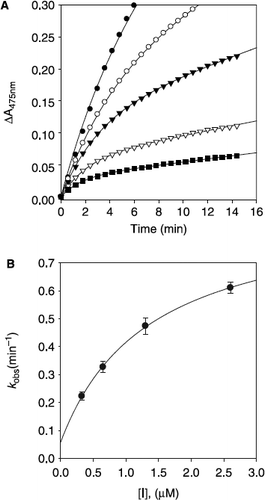
Figure 6.  Time-dependent inhibition of tyrosinase in the presence of norartocarpetin (5). (A) Conditions were as follows: 180 μM l–tyrosine, 144 units tyrosinase, and concentrations of norartocarpetin for curves from top to bottom were 0, 9.76, 19.53, 39.06, and 78.12 nM. The kobs values at each inhibition concentration were determined by fitting the data to Equation (2). (B) Dependence of the values for kobs on the concentration of norartocarpetin. The kobs values, determined in panel A, were fitted to Equation (3).

Reprints and Corporate Permissions

Please note: Selecting permissions does not provide access to the full text of the article, please see our help page How do I view content?

To request a reprint or corporate permissions for this article, please click on the relevant link below:

Academic Permissions

Please note: Selecting permissions does not provide access to the full text of the article, please see our help page How do I view content?

Obtain permissions instantly via Rightslink by clicking on the button below:

If you are unable to obtain permissions via Rightslink, please complete and submit this Permissions form. For more information, please visit our Permissions help page.