945
Views
13
CrossRef citations to date
0
Altmetric
Research Article

Isolation and characterization of a novel adenosine deaminase inhibitor, IADA-7, from Bacillus sp. J-89

, , , , &
Pages 59-64 | Received 22 Aug 2007, Accepted 30 Nov 2007, Published online: 20 Oct 2008

Figures & data

Figure 1.  Purification of an ADA inhibitor, IADA-7, from Bacillus sp. J-89.

Figure 1.  Purification of an ADA inhibitor, IADA-7, from Bacillus sp. J-89.

Figure 2.  Characterization of chemical structure of IADA-7. The chemical structure of IADA-7 was analyzed sequentially using an IR spectrum (A), 1H-NMR spectrum (B), and 13C-1H NMR spectrum (C).
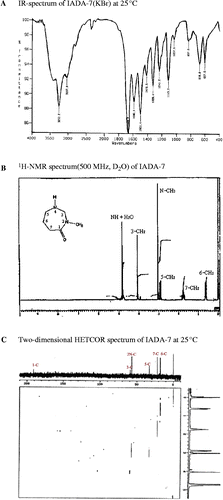
Figure 2.  Characterization of chemical structure of IADA-7. The chemical structure of IADA-7 was analyzed sequentially using an IR spectrum (A), 1H-NMR spectrum (B), and 13C-1H NMR spectrum (C).

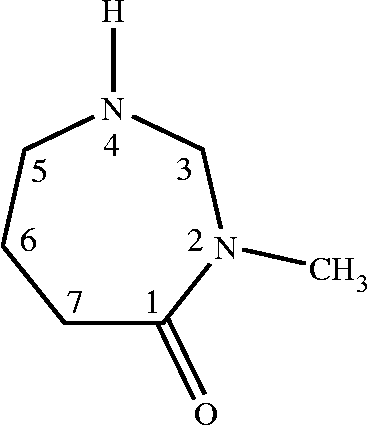
Figure 3.  Deduced structure of IADA-7.

Figure 3.  Deduced structure of IADA-7.

Figure 4.  Cytotoxic effect of IADA-7 on human Jurkat T cells (- - -○- - -) and human bladder carcinoma J 82 cells (•). Both cell lines were treated with the indicated concentration of IADA-7, and its cytotoxic effect was assessed via an MTT assay, as described in the Materials and Methods.
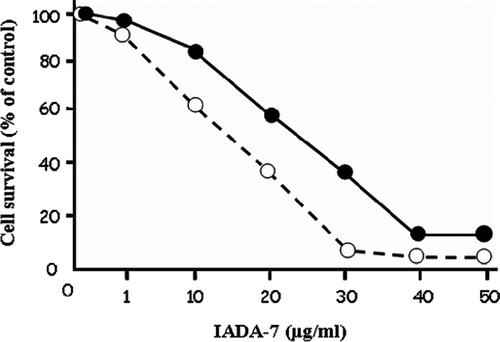
Figure 4.  Cytotoxic effect of IADA-7 on human Jurkat T cells (- - -○- - -) and human bladder carcinoma J 82 cells (•). Both cell lines were treated with the indicated concentration of IADA-7, and its cytotoxic effect was assessed via an MTT assay, as described in the Materials and Methods.

Figure 5.  Effect of purified IADA-7 on Jurkat T cells analysed by flow cytometry. Cells were treated with IADA-7 (15 μg/mL) for 0–48 h and assessed by propidium iodide (PI) staining, as described in Materials and Methods. Grey line represents control cells, and black line represents 24 h, 48 h sample cells, respectively. Apo: apoptotic percentage.
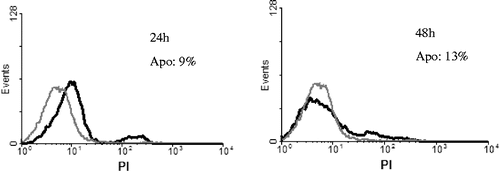
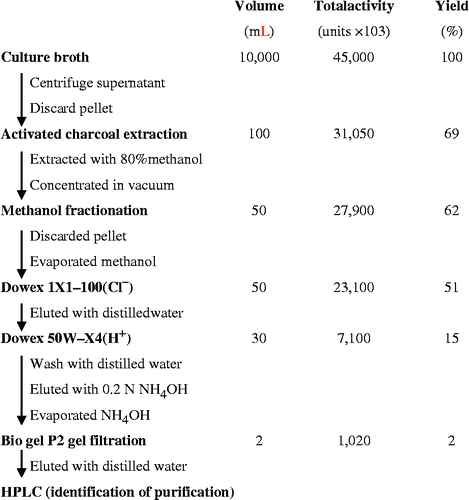
Figure 5.  Effect of purified IADA-7 on Jurkat T cells analysed by flow cytometry. Cells were treated with IADA-7 (15 μg/mL) for 0–48 h and assessed by propidium iodide (PI) staining, as described in Materials and Methods. Grey line represents control cells, and black line represents 24 h, 48 h sample cells, respectively. Apo: apoptotic percentage.
Reprints and Corporate Permissions

Please note: Selecting permissions does not provide access to the full text of the article, please see our help page How do I view content?

To request a reprint or corporate permissions for this article, please click on the relevant link below:

Academic Permissions

Please note: Selecting permissions does not provide access to the full text of the article, please see our help page How do I view content?

Obtain permissions instantly via Rightslink by clicking on the button below:

If you are unable to obtain permissions via Rightslink, please complete and submit this Permissions form. For more information, please visit our Permissions help page.