Figures & data
Figure 1. Effect of the methanolic extract and the fractions of P. Japonica on LPS-induced NO production in BV2 microglia. BV2 cells were washed with phenol red-free DMEM and incubated with test samples (100 μg/mL) for 1 h. The cultures were then stimulated by 100 n/mL of LPS for 24 h. After incubation, NO production was measured by the Griess reaction and sodium nitrite was used as the standard. NO production (NP) of control and LPS-treated cultures were 3.9 ± 0.1 and 17.7 ± 0.5 μM, respectively. The solid bar shows relative NO production (%) which was calculated as (NP of sample treated – NP of control)/(NP of LPS-treated – NP of control) × 100 (%). LPS-stimulated value differs significantly from control at a level of p < 0.001. Results differ significantly from the LPS-treated, *p < 0.05, **p < 0.01 and ***p < 0.001, respectively. The hatched bar shows the cell viability relative to control cultures.
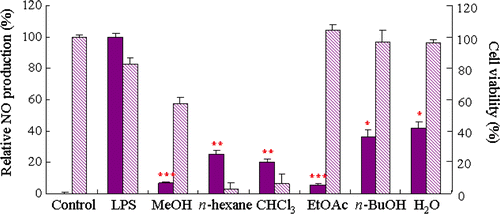
Figure 2. Structures of the compounds isolated from P. japonica.
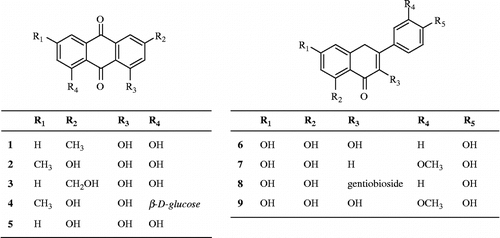
Table I. Effect of the isolated compounds from the leaves of P. Japonica on LPS-induced NO production in BV2 microglia.