789
Views
20
CrossRef citations to date
0
Altmetric
Research Article

Update on biochemical properties of recombinant Pseudomonas diminuta phosphotriesterase

, , , , &
Pages 1045-1055 | Received 16 Jun 2008, Accepted 21 Oct 2008, Published online: 23 Jun 2009

Figures & data

Scheme 1. Paraoxon hydrolysis.

Scheme 1.  Paraoxon hydrolysis.

Figure 1. Typical gel filtration of Co-PTE and Zn-PTE. The size of Zn- or Co-PTE in solution was determined by gel filtration with an initial enzyme concentration of 1 mg/mL and a volume sample of 200 μL. A gel filtration of Co-PTE is shown. The absorbance profiles of Co-PTE (bold dashed line) and molecular weight standards (thin line) were recorded at 280 nm. The molecular weight of β-lactoglobulin (14.4 kDa), ovalbumin (43 kDa) and bovine serum albumin (67 kDa), and the estimated value of Co-PTE (36 kDa) are indicated at the top of each corresponding peaks.
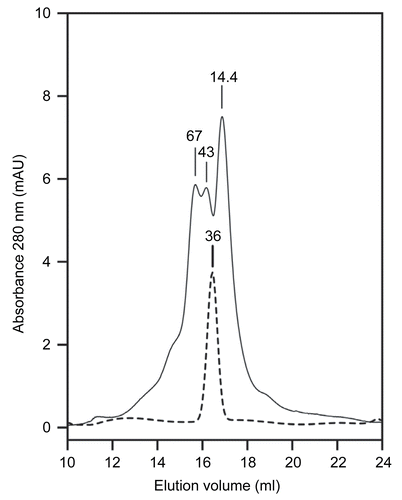
Figure 1.  Typical gel filtration of Co-PTE and Zn-PTE. The size of Zn- or Co-PTE in solution was determined by gel filtration with an initial enzyme concentration of 1 mg/mL and a volume sample of 200 μL. A gel filtration of Co-PTE is shown. The absorbance profiles of Co-PTE (bold dashed line) and molecular weight standards (thin line) were recorded at 280 nm. The molecular weight of β-lactoglobulin (14.4 kDa), ovalbumin (43 kDa) and bovine serum albumin (67 kDa), and the estimated value of Co-PTE (36 kDa) are indicated at the top of each corresponding peaks.

Figure 2. X-Ray Fluorescence spectrum of recombinant Zn-PTE and Co-PTE. XRF spectrum for energy between 5 and 10 KeV of 0.1 mM Zn-PTE (a) and 0.1 mM Co-PTE (b).
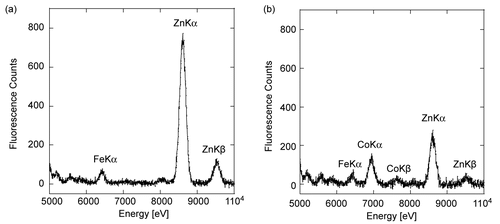
Figure 2.  X-Ray Fluorescence spectrum of recombinant Zn-PTE and Co-PTE. XRF spectrum for energy between 5 and 10 KeV of 0.1 mM Zn-PTE (a) and 0.1 mM Co-PTE (b).

Figure 3. Stability of Zn-PTE and Co-PTE under assay conditions. Paraoxon hydrolysis of Zn-PTE and Co-PTE in the absence of additives, with 0.1% of β-lactoglobulin, with 50 μM ZnCl2 and with both additives, 5 minutes after dilution of the stock enzyme.
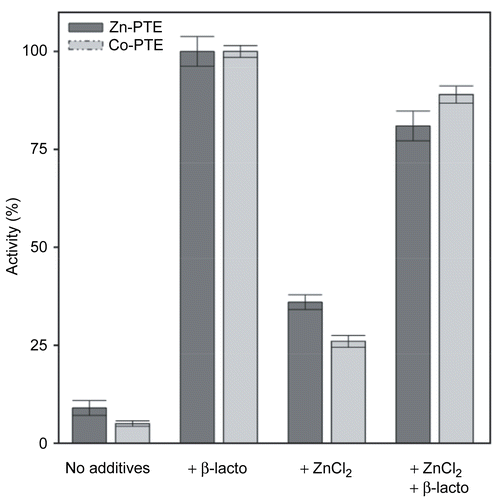
Figure 3.  Stability of Zn-PTE and Co-PTE under assay conditions. Paraoxon hydrolysis of Zn-PTE and Co-PTE in the absence of additives, with 0.1% of β-lactoglobulin, with 50 μM ZnCl2 and with both additives, 5 minutes after dilution of the stock enzyme.

Figure 4. Michaelis-Menten Plot of paraoxon hydrolysis by Zn-PTE and Co-PTE. Initial reaction rate plotted against substrate concentration for paraoxon hydrolysis by PTE purified with Zn2+(○) and Co2+(□).
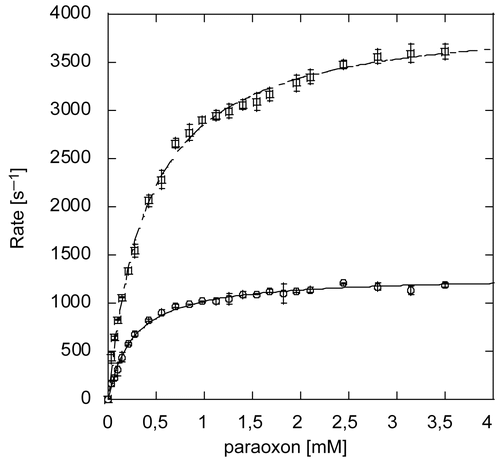
Figure 4.  Michaelis-Menten Plot of paraoxon hydrolysis by Zn-PTE and Co-PTE. Initial reaction rate plotted against substrate concentration for paraoxon hydrolysis by PTE purified with Zn2+(○) and Co2+(□).

Table 1. Paraoxon hydrolysis catalyzed by recombinant wild type PTE expressed in the presence of zinc and cobalt chloride and mutants expressed in the presence of cobalt chloride.

Figure 5. Inhibition of paraoxon hydrolysis of Co-PTE and Zn-PTE by ZnCl2. Reaction rate versus paraoxon concentration for Zn-PTE (a) and Co-PTE (b) in the absence (○) and presence of 0.1 mM (□), 0.25 mM (×) and 0.5 mM (+) ZnCl2. Lineweaver-Burk plot of Zn-PTE (c) and Co-PTE (d) activities in the absence (○) and presence of 0.1 mM (□), 0.25 mM (×) and 0.5 mM (+) ZnCl2. Dixon plots of Zn-PTE (e) and Co-PTE (f) with0.28 mM (○), 0.42 mM (□), 0.56 mM (×), 0.7mM (+), 3.5 mM (△) paraoxon. The best-fit curves or lines were determined using GOSA-fit and Equation (2), with n=2 for Zn-PTE and n=1 for Co-PTE.
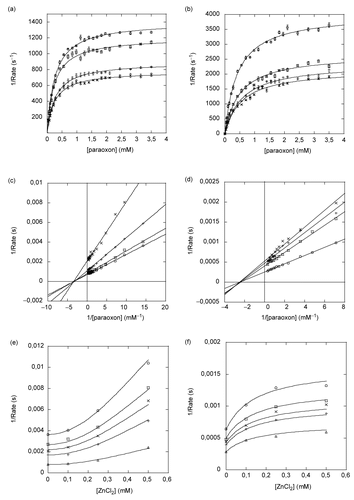
Figure 5.  Inhibition of paraoxon hydrolysis of Co-PTE and Zn-PTE by ZnCl2. Reaction rate versus paraoxon concentration for Zn-PTE (a) and Co-PTE (b) in the absence (○) and presence of 0.1 mM (□), 0.25 mM (×) and 0.5 mM (+) ZnCl2. Lineweaver-Burk plot of Zn-PTE (c) and Co-PTE (d) activities in the absence (○) and presence of 0.1 mM (□), 0.25 mM (×) and 0.5 mM (+) ZnCl2. Dixon plots of Zn-PTE (e) and Co-PTE (f) with0.28 mM (○), 0.42 mM (□), 0.56 mM (×), 0.7mM (+), 3.5 mM (△) paraoxon. The best-fit curves or lines were determined using GOSA-fit and Equation (2), with n=2 for Zn-PTE and n=1 for Co-PTE.
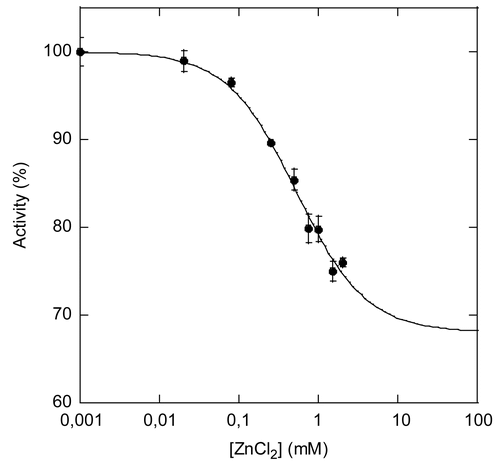
Figure 6. Inhibition of Co-PTE-catalyzed hydrolysis of an analogue of VX by ZnCl22. Hydrolysis of an analogue of VX by Co-PTE in the presence of increasing concentrations of ZnCl2 up to 2 mM.

Figure 6.  Inhibition of Co-PTE-catalyzed hydrolysis of an analogue of VX by ZnCl22. Hydrolysis of an analogue of VX by Co-PTE in the presence of increasing concentrations of ZnCl2 up to 2 mM.

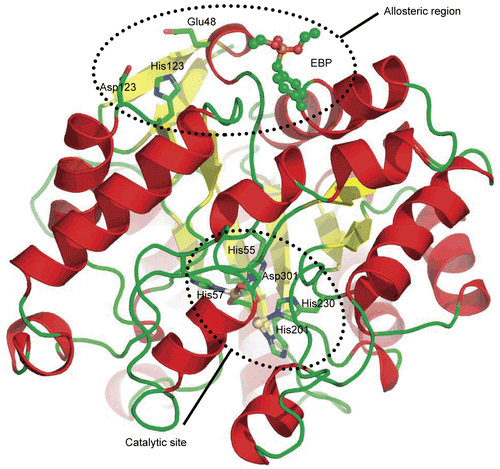
Figure 7. Crystal structure of PTE. Cartoon view of the crystal structure of PTE-Cd/Cd (pdb code 1PSC). α-Helixes are in red and β-sheets in yellow. The allosteric ligand EBP is represented in ball and stick. Residues from the putative Zn binding site and the catalytic site are in stick.

Figure 7.  Crystal structure of PTE. Cartoon view of the crystal structure of PTE-Cd/Cd (pdb code 1PSC). α-Helixes are in red and β-sheets in yellow. The allosteric ligand EBP is represented in ball and stick. Residues from the putative Zn binding site and the catalytic site are in stick.

Reprints and Corporate Permissions

Please note: Selecting permissions does not provide access to the full text of the article, please see our help page How do I view content?

To request a reprint or corporate permissions for this article, please click on the relevant link below:

Academic Permissions

Please note: Selecting permissions does not provide access to the full text of the article, please see our help page How do I view content?

Obtain permissions instantly via Rightslink by clicking on the button below:

If you are unable to obtain permissions via Rightslink, please complete and submit this Permissions form. For more information, please visit our Permissions help page.