Figures & data
Figure 1. Structure of ectoine and 5-hydroxyectoine
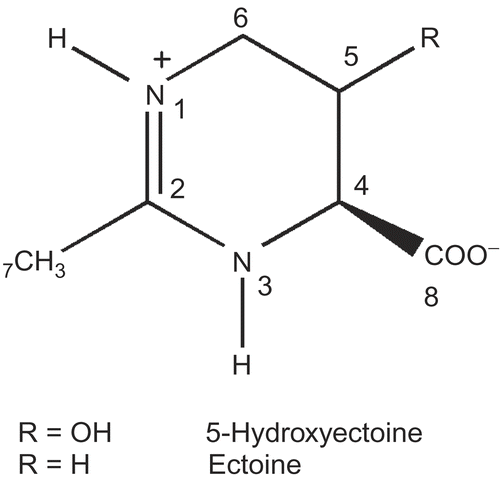
Figure 2. Lineweaver-Burk plots for inhibition of N-acetyl-ß-D-glucosaminidase by 2-acetamido-2-deoxy-D-glucono-1,5-lactone at different concentrations; 0 μM (▪), 0.11 μM (![]()
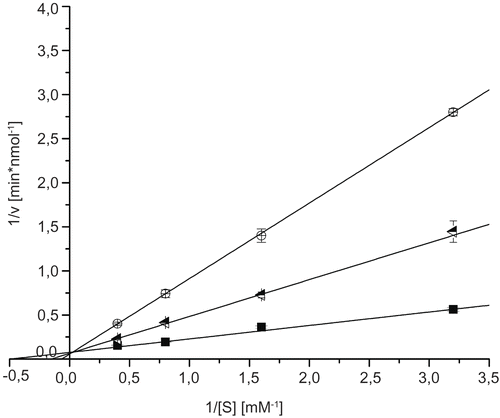
Figure 3. Lineweaver-Burk plots for inhibition of N-acetyl-ß-D-glucosaminidase by ectoine and 5-hydroxyectoine; blank (▪), 210 μM ectoine (![]()
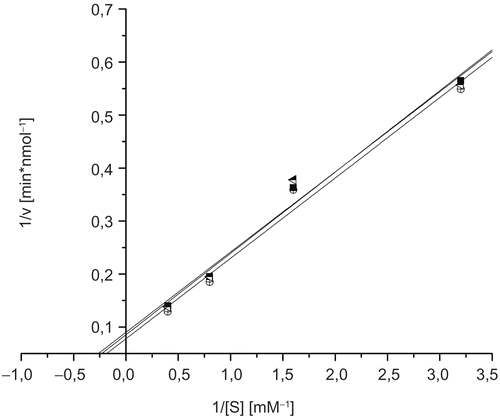
Table 1. Comparison of 1H-NMR data of ectoine [Citation11] and pyrostatin B [Citation1]
Table 2. Comparison of 13C-NMR data of ectoine [Citation11] and pyrostatin B [Citation1]