Figures & data
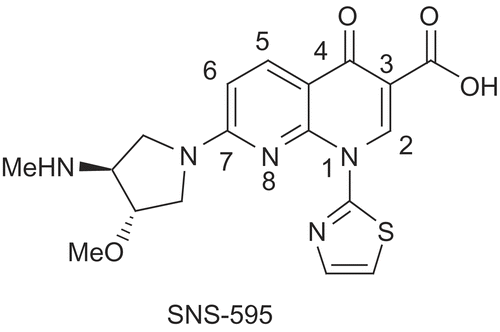
Figure 1. Structure of reference compound.
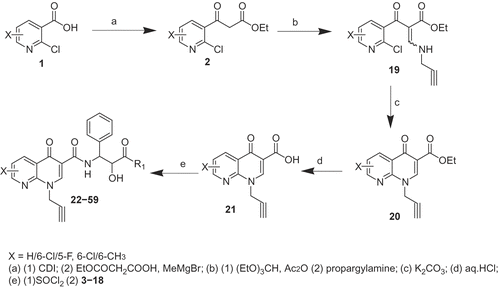
Scheme 1. Synthesis of tested compounds (22–59).
Scheme 2. Synthesis of tested compounds (60–62).
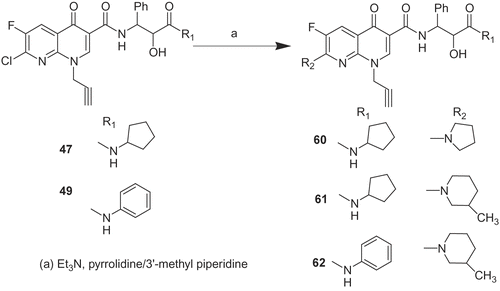
Table 1. Functionalised amino acid derivatives (3–18).
Table 2. 1,8-Naphthyridine derivatives (22–62).
Table 3. In vitro cytotoxicity of 1,8-Naphthyridine derivatives (22–62).
Figure 2. Anti-inflammatory activity as a measure of TNF-α downregulation.
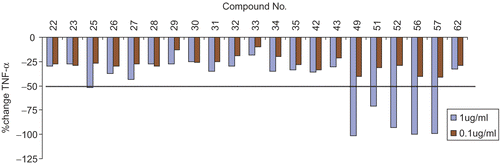
Table 4. IC50 values for TNF-α modulation by selected 1,8-naphthyridine carboxamide derivatives. Molecules were subjected to screening over a multiple dose concentration range of 0.001 μg/mL to 10 μg /mL.
Figure 3. IL-1-β modulation of selected molecules. Dotted line shows IC50 (concentration at which 50% inhibition occurs).
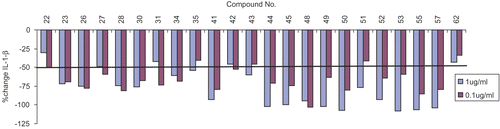
Figure 4. MIP-1-α modulation of selected molecules. Dotted line shows IC50 (concentration at which 50% inhibition occurs).
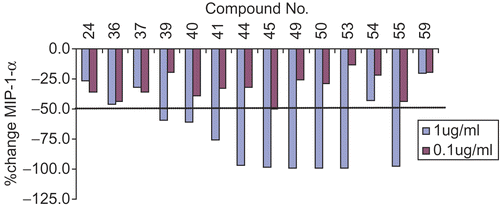
Figure 5. IP-10 modulation of selected molecules. Dotted line shows IC50 (concentration at which 50% inhibition occurs).
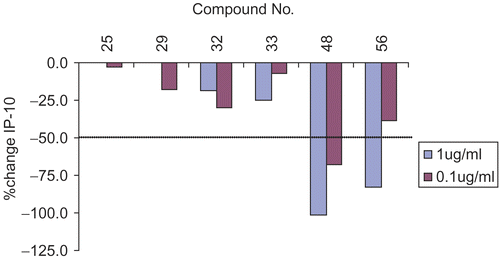
Table 5. Downregulation of IP-10 levels to 50% (IC50) of selected 1,8-naphthyridine derivatives. Molecules were subjected to screening over a multiple dose concentration range of 0.001 μg/mL to 10 μg/mL.