Figures & data
Figure 1. Pentose phosphate pathway (PPP) and glutathione coupling: Glucose-6-phosphate dehydrogenase (G6PD), 6-phosphogluconate dehydrogenase (6PGD), glutathione reductase (GR), glutathione (GSH), oxidized glutathione (GSSG), glutathione peroxidase (GPx).
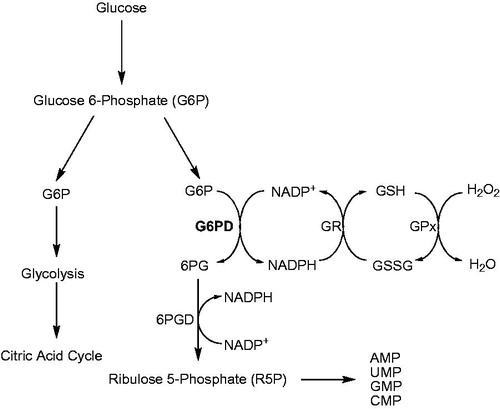
Figure 2. Activity% versus [MIBI] regression analysis graphs for hG6PD in the presence of seven different MIBI concentrations.
![Figure 2. Activity% versus [MIBI] regression analysis graphs for hG6PD in the presence of seven different MIBI concentrations.](/cms/asset/1caf0453-39a8-43b4-b414-97018f0efb07/ienz_a_1178735_f0002_c.jpg)
Figure 3. Activity% versus [DTPA] regression analysis graphs for hG6PD in the presence of seven different DTPA concentrations.
![Figure 3. Activity% versus [DTPA] regression analysis graphs for hG6PD in the presence of seven different DTPA concentrations.](/cms/asset/e21d49aa-9d57-491a-a0a4-5456ca234ecc/ienz_a_1178735_f0003_c.jpg)
Figure 4. Activity% versus [DMSA] regression analysis graphs for hG6PD in the presence of six different DMSA concentrations.
![Figure 4. Activity% versus [DMSA] regression analysis graphs for hG6PD in the presence of six different DMSA concentrations.](/cms/asset/dea3cfe0-48c0-412a-bc2d-4ee0a75bc283/ienz_a_1178735_f0004_c.jpg)
Figure 5. Activity% versus [MDP] regression analysis graphs for hG6PD in the presence of six different MDP concentrations.
![Figure 5. Activity% versus [MDP] regression analysis graphs for hG6PD in the presence of six different MDP concentrations.](/cms/asset/d58b5764-2499-467a-bdf2-39cdbcc42f12/ienz_a_1178735_f0005_c.jpg)
Table 1. Purification scheme of hG6PD by 2′,5′-ADP sepharose 4B affinity gel chromatography.
Table 2. IC50 and predicated binding energy values of hG6PD inhibitors.
Figure 6. RMSD evolution of Cα of hG6PD in complexes with MDP, DTPA and DMSA compounds, and control system (upper panel) and also heavy atoms of three ligands into the active site (lower panel) during 10 ns MD simulation.
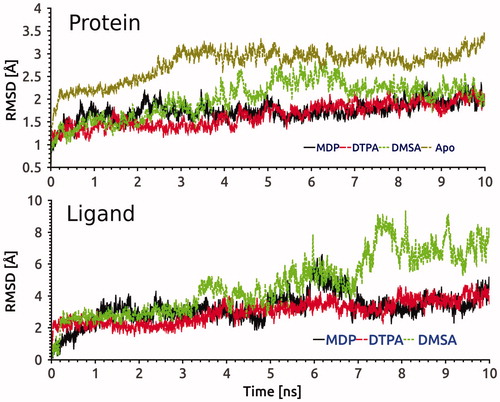
Figure 7. Protein–ligand interaction analysis of MDP, DTPA and DMSA into the ligand-binding pocket of hG6PD throughout the MD simulations.
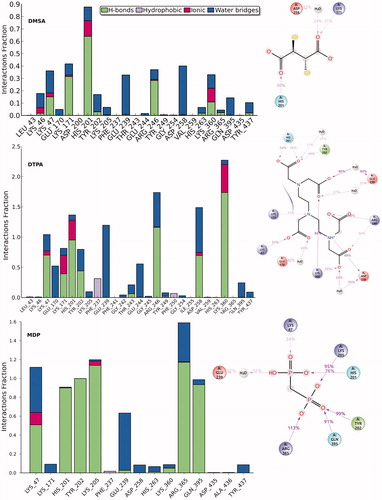
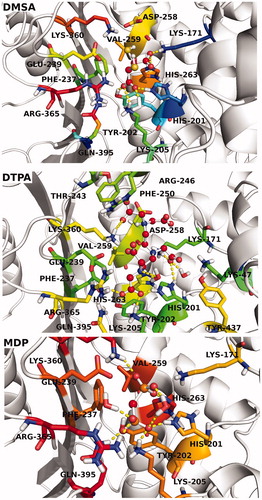
Figure 8. 3D ligand interaction diagrams of studied compounds.