Figures & data
Figure 1. Structure of the selected flavonoids: 3-Hydroxy flavones (R-OH, R1, R2, R3, R4, R5, R6 -H); 5-Hydroxy flavone (R1-OH, R, R2, R3, R4, R5, R6-H); 6-Hydroxyflavone (R2-OH, R, R1, R3, R4, R5, R6-H); 7-Hydroxy flavone (R3 - OH, R, R1, R2, R4, R5, R6 - H,); 2′- Hydroxy flavone (R5-OH, R, R1, R2, R3, R4, R6-H,); 4′-Hydroxy flavone (R6-OH, R, R1, R2, R3, R4, R5-H).
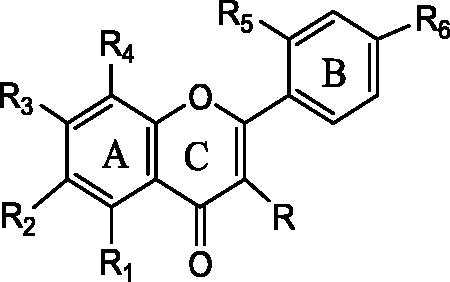
Figure 2. Digitized representative images of the bovine lenses showing effect of selected flavonoids (50 μM) on glycation-induced opacity, haziness, disruption and other morphological changes. The images of lenses were digitized after 15 days of incubation. Minimum four lenses (from two animals) were used in each set.
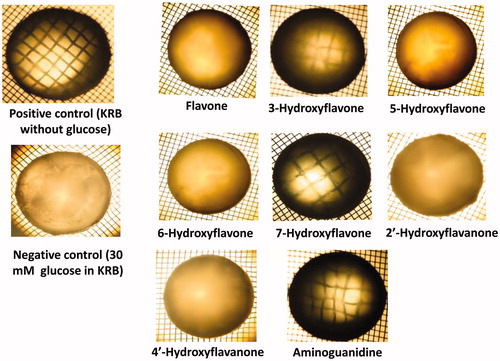
Table 1. Profile of protein concentrations, amount of protein carbonyls and size of protein aggregates in glycation-induced lenses treated with different flavonoids.
Figure 3. Effect of selected flavonoids (50 μM) on glycation induced AGEs fluorescence of lens proteins. The result summarized is the representative image of individual four experiments performed with four lenses (derived from two animals).
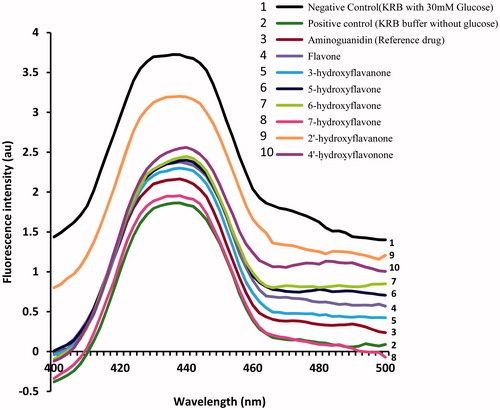
Figure 4. Representative image panel of effect of 7-hydroxy flavone (50 μM) on glycation induced lens crystalline aggregate formation. The effect of selected flavonoids (50 μM) on glycation induced lens crystalline aggregate formation was analyzed by measuring the sizes of lens protein aggregates using NTA LM 20 analysis system. (A) Plot representing particle size (nm) and concentration (particle/ml). Value 135 is a mode size (in nm) of observed nano particles. (B) Still frame from video of nano sizing experiment (refer on line supplementary video). (C) Plot representing particle size (nm) and normalized intensity. (D) A 3D plot of particle size (10 nm per division) and relative intensity. The results summarized are the mean value of four lenses (derived from two animals) each used in individual four experiments.
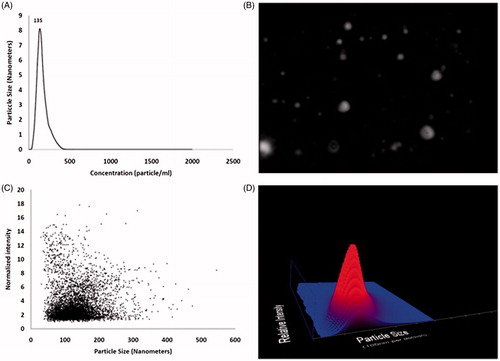
Table 2. Summary of AR inhibition potential of selected flavonoids.
Table 3. In silico data obtained from virtual screening and structural analysis of flavonoids in aldose reductase.
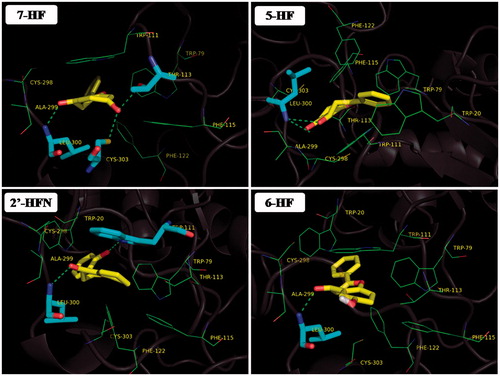
Figure 5. Docking results of promising flavanoids (yellow sticks) in Aldose reductase (cartoon representation). Residues in hydrophobic contacts are depicted in green color lines. Atoms of residues engaging hydrogen bonds (green dotted lines) with flavonoid molecules are shown as cyan sticks.