Figures & data
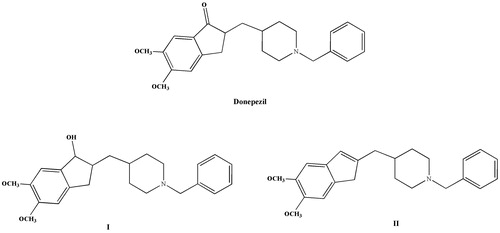
Figure 1. Structures of some AChE inhibitors: donepezil and indanol- and indene-based derivatives (I and II) reported as AChE inhibitors.
Scheme 1. Reagents and conditions: (a) oxalyl chloride, CH2Cl2, room temperature, 12 h; (b) AlCl3, CH2Cl2, 0 °C, ice bath; (c) Dimethyl carbonate, NaH, 90 °C, reflux; (d) appropriate aniline, dioxane, microwave; (e) NaBH4, THF, MeOH, 2 h; (f) MeOH, PTSA, reflux, 25 min. *R1, R2, R3 substituent groups at the o-, m- and p- positions: H, CH3, C2H5, OCH3, OC2H5, F, Cl and Br.
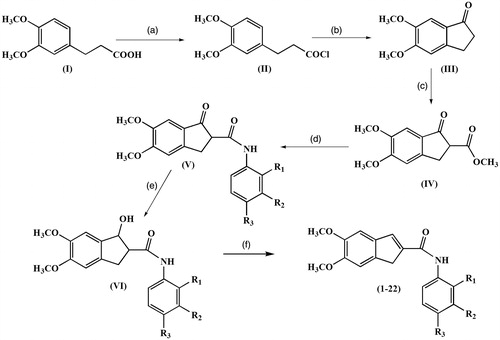
Table 1. Anticholinesterase activity, inhibition of self-induced Aβ1–42 aggregation of the compounds (1–22).
Figure 2. Lineweaver–Burk plots of inhibition kinetics of the compounds 20 and 21.
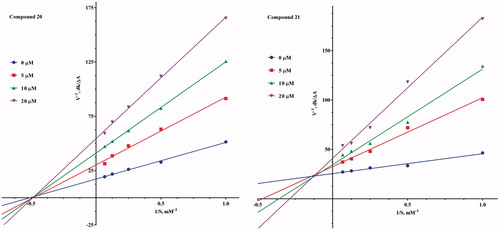
Figure 3. Inhibition of self-induced Aβ1–42 aggregation by the test compounds and reference curcumin at concentration 25 μM.
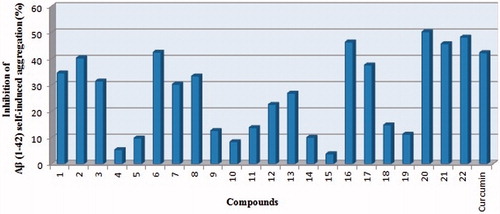
Figure 4. (a) UV absorption spectra of compound 20 (100 μM in DMSO) alone, (b) UV absorption spectra of the mixture compound 20 (100 μM) and CuSO4 (100 μM), (c) UV absorption spectra of the mixture compound 20 (100 μM) and FeSO4 (100 μM) and (d) UV absorption spectra of the mixture compound 20 (100 μM) and ZnSO4 (100 μM).
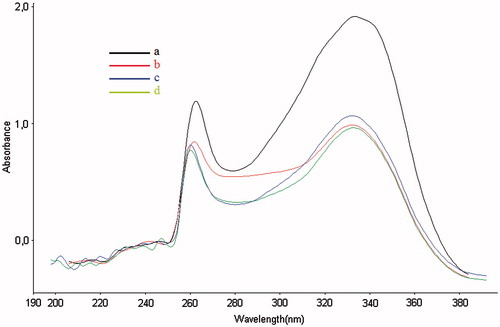
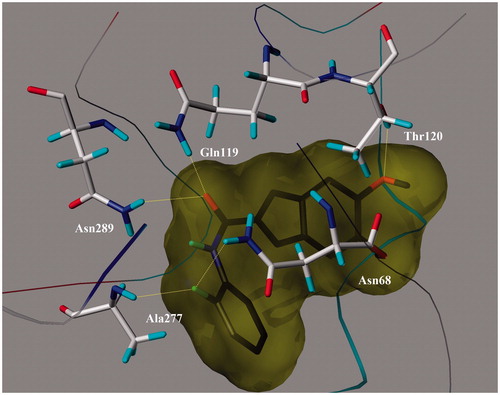
Figure 5. 3D representation of the binding mode of the most potent inhibitor 21 at the active sites of AChE.
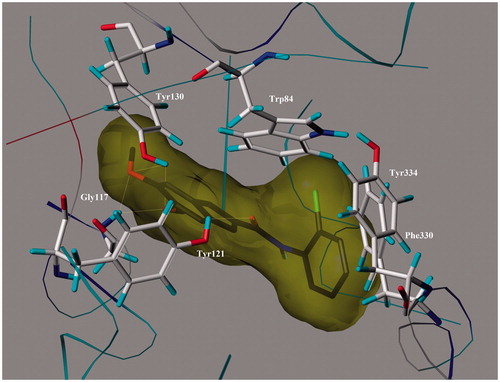
Figure 6. 3D representation of the binding mode of the most potent inhibitor 20 at the active sites of BuChE.