Figures & data
Scheme 1. Synthesis of the target compounds 4a–v.
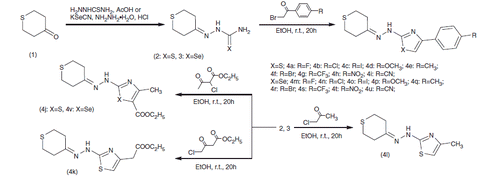
Table 1. The antifungal activity data expressed as MIC [μg/ml] and, in parentheses, as MFC [μg/ml] for compounds 4a–v.
Table 2. The antibacterial activity data expressed as MIC [μg/ml] and, in parentheses, as MBC [μg/ml] for compounds 4a–v.
Figure 1. Influence of the test compounds 4a, 4b, 4e, 4m, 4n and 4q on latency to the first seizure episode in PTZ-induced seizures. Statistical analysis: one-way analysis of variance (ANOVA), followed by Dunnett’s post hoc comparison. 4a: F[2,24] = 5.488, p < 0.05; 4b: F[2,23] = 18.22, p < 0.0001; 4e: F[2,24] = 1.965, p > 0.05; 4m: F[2,24] = 4.510, p < 0.05; 4n: F[2,23] = 9.384, p < 0.01; 4q: F[2,22] = 2.746, p > 0.05. Significance vs. vehicle-treated group: * p < 0.05, ** p < 0.01, *** p < 0.001.
![Figure 1. Influence of the test compounds 4a, 4b, 4e, 4m, 4n and 4q on latency to the first seizure episode in PTZ-induced seizures. Statistical analysis: one-way analysis of variance (ANOVA), followed by Dunnett’s post hoc comparison. 4a: F[2,24] = 5.488, p < 0.05; 4b: F[2,23] = 18.22, p < 0.0001; 4e: F[2,24] = 1.965, p > 0.05; 4m: F[2,24] = 4.510, p < 0.05; 4n: F[2,23] = 9.384, p < 0.01; 4q: F[2,22] = 2.746, p > 0.05. Significance vs. vehicle-treated group: * p < 0.05, ** p < 0.01, *** p < 0.001.](/cms/asset/8c6b44df-f587-4368-9460-f02de67281a6/ienz_a_1186020_f0001_b.jpg)
Table 3. Anticonvulsant activity of the test compounds in 6-Hz test.
Figure 2. The four investigated orientations of 4a with respect to the β-cyclodextrin.
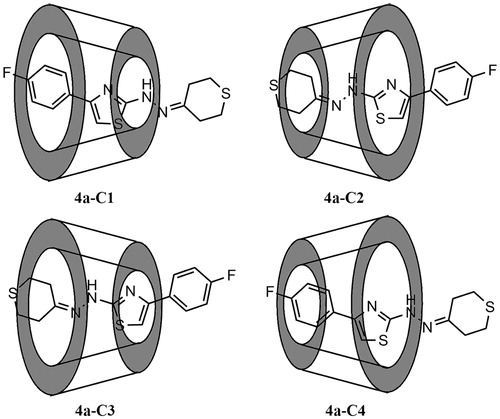
Table 4. The B3LYP/6–31G** relative energies, and the M06–2X/6–31G** and M06–2X/6–311G** interaction (ΔE) and binding (Ebind) energies of 4a–β-cyclodextrin complex.
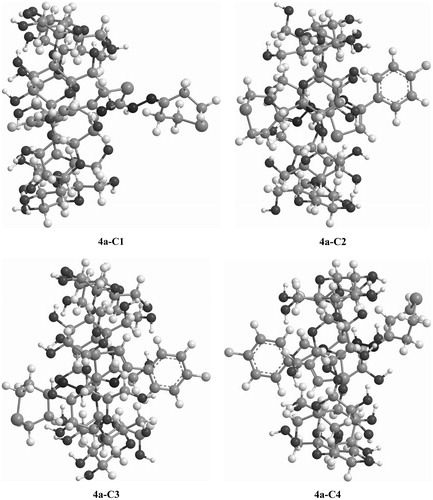
Figure 3. Optimized structures of 4a-β-cyclodextrin complex obtained within the DFT/B3LYP/6–31G** approximation.