Figures & data
Figure 1. Structures of compound 1 in-house library and isolated compounds 2–13 from R. undulatum.
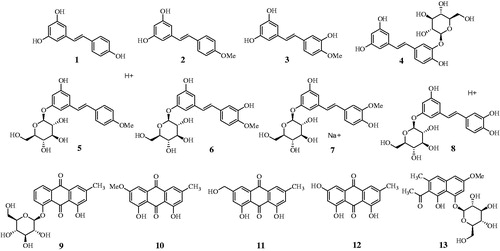
Table 1. Effects of extract of R. undulatum Linne. on sEH inhibitory activity. (1, methanol extract; 2, n-hexane fraction; 3, chloroform fraction; 4, buthanol fraction).
Figure 2. (A) Effects of compounds 1–9, 11, and 12 on the activity of sEH. (B–L) Lineweaver–Burk plots of sEH inhibition by compounds 1–9, 11, and 12.
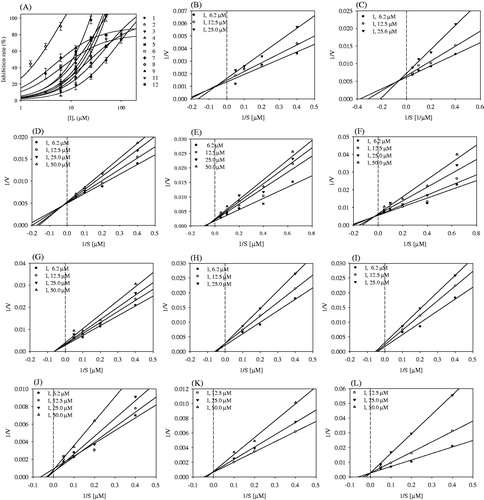
Table 2. The sEH inhibitory activities of compounds 1–13 from R. undulatum Linne.
Figure 3. (A) Overlapping inhibitors (1–9, 11, and 12), and (B–L) predicted binding pose of compounds 1–9, 11, and 12 into the sEH, respectively.
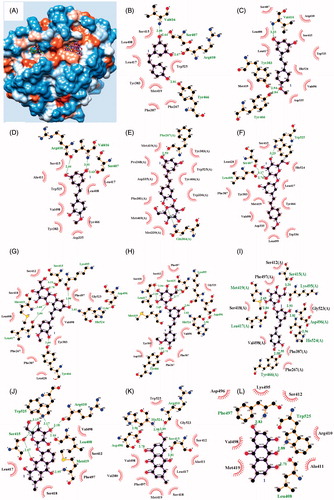
Table 3. Interection and Autodock score between sEH and inhibitor (1–9, 11, and 12).
Figure 4. (A) The total and (B) potential energy of the simulation calculated during 10 000 ps (10 ns). (C) RMSD plot of compound-sEH complex for 10 ns time frame. (D) Residue fluctuations observed using the RMSF plots. Number of hydrogen bonds between the compounds 8 (E) and 12 (F) and sEH. The interaction distance of key residues between the ligands (8:G and 12:H) and sEH.
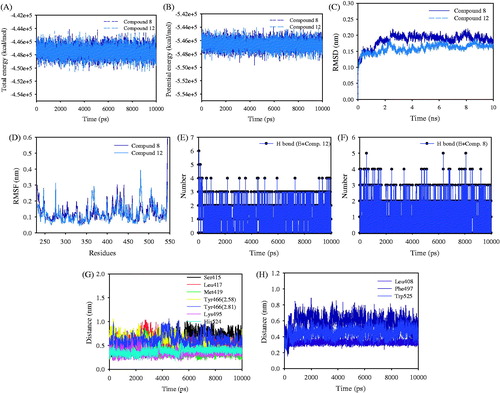
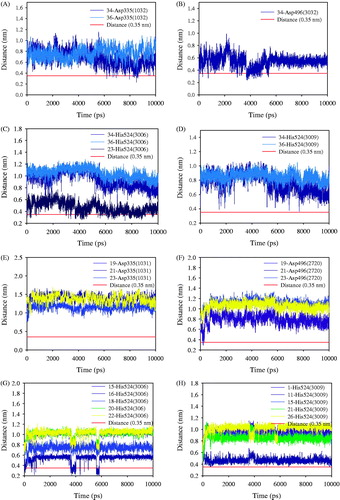
Figure 5. The distance of compounds 8 (A–D) and 12 (E–H) with catalytic triad in activity site (Asp335, Asp496, and His524) for the molecular dynamic simulation, respectively.