Figures & data
Figure 1. (a) X-ray co-crystal structure of BPTI (ribbon representation) bound to the WNV NS2B-NS3 protease (surface representation). Amber and green ribbons represent G12 to Y21 (fragment 1) and T32 to R39 (fragment 2) of BPTI, respectively. NS2B and NS3 are colored cyan and gray, respectively; (b) Stick model of peptide 1 bound to the protease active site using 2IJO.pdb as template. The C14–C38 disulfide bond is colored yellow. The surface of the acidic residues D75 and S135 and basic residue H51 of the catalytic triad is colored red and blue; (c) Stick model of peptide 3. Fragment 1 and protease residues are labeled black and purple; (d) Stick representation of peptide 3. Fragment 2 and protease residues are labeled black and yellow, respectively; (e) Stick model of cyclic peptide 19. Residues in amber and green represent fragment 1 and 2, respectively. Yellow bonds represent disulfide bridges.
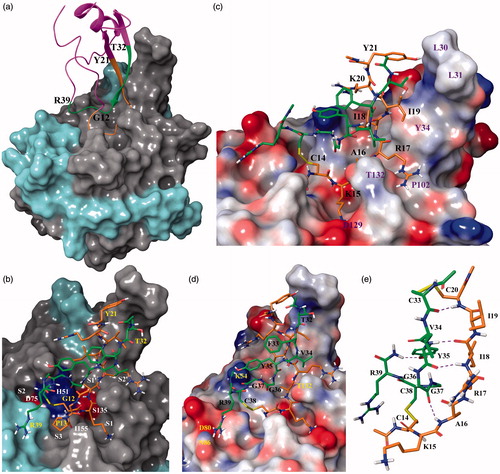
Table 1. Inhibitory activities of BPTI and truncated peptides against the WNV NS2B-NS3 protease.
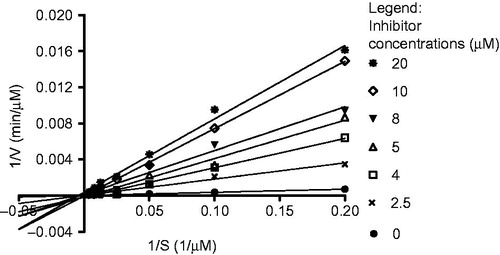
Figure 2. Lineweaver–Burk plot showing competitive inhibition of the WNV NS2B-NS3 protease by peptide 19 using Pyr-RTKR-AMC as substrate.