Figures & data
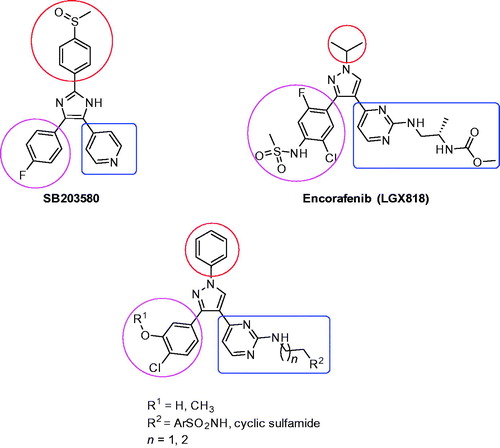
Figure 1. Structures of SB203580, Encorafenib (LGX818), and rationale design to the target compounds 1a–l and 2a–l.
Scheme 1. Reagents and conditions: (a) (i) triethylamine, CH2Cl2, 0 °C, RT, overnight; (ii) N-ethyl ethylenediamine, C5H5N, reflux, 3 h; (iii) benzyloxycarbonyl chloride, TEA, CH2Cl2, 0 °C; (iv) methanesulfonyl chloride, TEA, CH2Cl2, 0 °C; (v) IV, NaH (60% dispersion in mineral oil), DMF; (vi) H2/Pd-C, MeOH, RT, 1 h; (b) (CH3)2SO4, K2CO3, acetone, reflux, 3 h; (c) KMnO4, C5H5N, H2O, 50 °C, 24 h, then RT, 13 h; (d) acetyl chloride, CH3OH, RT, 15 h; (e) 4-methyl-2-(methylthio)pyrimidine, LiHMDS, THF, −78 °C, 2 h then RT, overnight; (f) (i) DMF-DMA, 80 °C, 3 h; (ii) phenylhydrazine, C2H5OH, RT, overnight; (g) oxone, MeOH, H2O, RT, 16 h; (h) 3a–l, diisopropylethylamine, DMSO, 80 °C, 16 h; (i) BBr3, CH2Cl2, −78 °C, 1 h; RT, overnight.
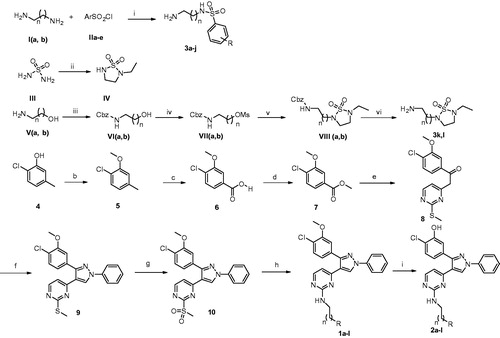
Table 1. Structures of the target compounds 1a–l and 2a–l, their yield percentage, and melting points.
Table 2. Mean percentage growth of the 53 cancer cell line panel after treatment with the tested target compounds (10 μM concentration).
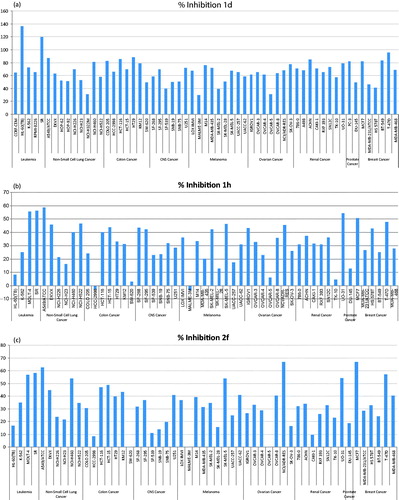
Figure 2. Percentage inhibition expressed by compounds 1d (a), 1h (b), and 2f (c) at 10 μM concentration over all cell lines of the NCI cancer cell line panel of nine different cancer types. The inhibition percentages are calculated by subtracting the growth percentages from 100.