Figures & data
Figure 1. Chemical structure of I-432.
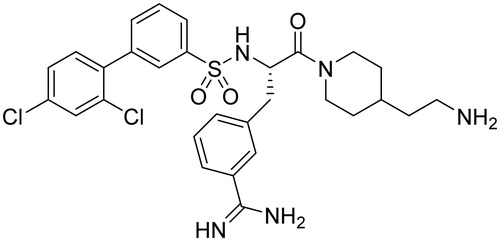
Figure 2. Expression of TMPRSS2 in IPEC-J2 cells. IPEC-J2 cells were untreated or exposed to I-432 for 48 h at 50 μM in phenol red free DMEM at pH = 7.4 at 37 °C. Cell lysates were prepared and analyzed by immunoblotting using polyclonal TMPRSS2 Ab. The full length of TMPRSS2 present in IPEC-J2 cells appeared as a 72 kD band, the truncated form as a 62 kDa band and serine protease domain as 28 kDa band on the blot, whereas β-actin (42 kDa) was used as reference housekeeping protein on the same blot. (A) Relative expression levels for full length form with apparent molecular mass of ∼72 kDa in I-432 treated samples versus control (p = 9.3535 × 10⁻⁵). (B) Relative expression levels for truncated form with apparent molecular mass of ∼62 kDa in I-432 treated samples versus control (p = 0.00357). (C) Relative expression levels for serine protease domain with apparent molecular mass of ∼28 kDa in I-432 treated samples versus control (p = 0.02057). Relative expression levels of detected protein products were compared in I-432 and in mock (Co) IPEC-J2 samples based on densitometric quantification of blot bands. Data are presented as average relative expression intensities ± SDs. Results shown are representative of three independent experiments.
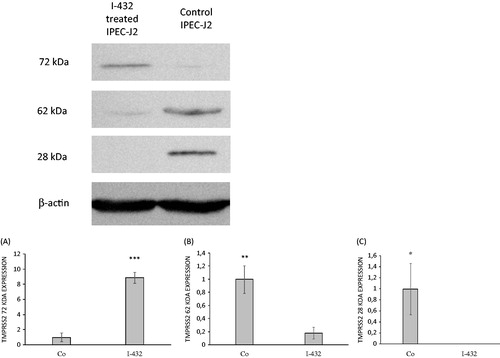
Figure 3. Measurements of enzymatic TMPRSS2 activity using the fluorescence substrate I-507 at 200 μM in presence of inhibitor I-432 apically applied at 10, 25 and 50 μM for 48 h in IPEC-J2 cell system. (A) Enzymatic activity assay of shed TMPRSS2 in the supernatant of IPEC-J2. The data are indicated as average fluorescence intensities ± SDs (n = 3). Significant differences can be seen between IPEC-J2 cells exposed to I-432 at 10 μM (p = 0.02039), at 25 μM (p = 0.00113), at 50 μM (p < 0.001) for 48 h compared to those in untreated samples. (B) Activity measurements of cell-associated TMPRSS2 in control and in inhibitor-treated IPEC-J2, the data are indicated as average fluorescence intensities ± SDs. No significant differences were found in control and inhibitor-treated IPEC-J2 cells (n = 3, p > 0.05).
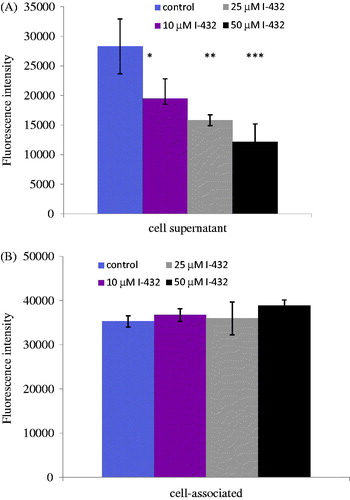
Figure 4. Detection of extracellular H2O2 production when IPEC-J2 cells were treated with 50 μM I-432 for 48 h apically using apical and basolateral sampling. Data are presented as average fluorescence intensities ± SDs. Apical treatment with I-432 did not result in significant alterations in peroxide level independently of the sampling type (p = 0.954 for apical sampling, p = 0.436 for basolateral sampling, n = 3).
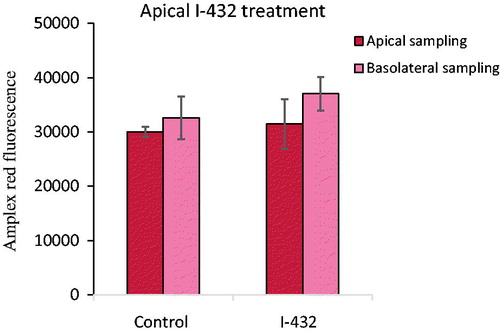
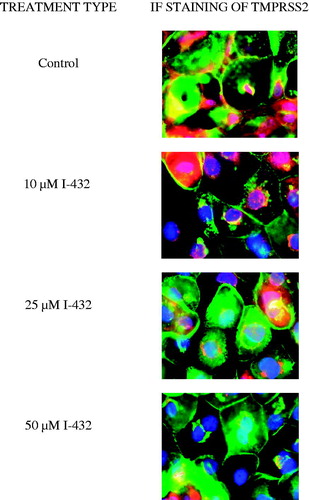
Figure 5. Immunostaining of TMPRSS2 expression pattern in IPEC-J2 cells cultured on polyester membrane inserts treated with inhibitor I-432 at 10, 25 and 50 μM for 48 h. Cell nuclei are stained blue (DAPI), cell membranes are labeled with wheat germ agglutinin (Alexa 488, green). In control samples, TMPRSS2 (Alexa 564, red) is colocalized with wheat germ agglutinin. 48 h long treatment of I-432 induced significant fluorescent signal loss of TMPRSS2. TMPRSS2 occurence was mainly observed around synthesis sites in I-432-treated IPEC-J2 cells. 600× magnification. The scale bar (white) indicates 20 μm (n = 3).