Figures & data
Figure 1. CYP26-catalyzed metabolism of tazarotenic acid to tazarotenic acid sulfoxide.
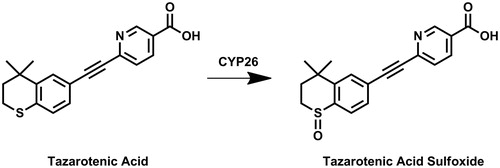
Figure 2. Structures of key compounds used to compare inhibition of tazarotenic acid sulfoxidation to retinoic acid 4-hydroxylation as noted in Table 1 or in docking simulations.
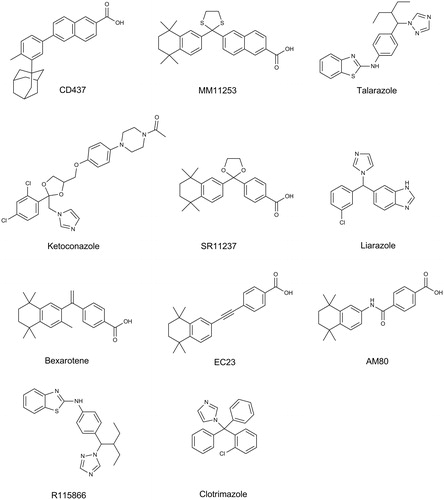
Table 1. Inhibition of tazarotenic acid sulfoxide formation in recombinant CYP26 enzymes by known inhibitors of retinoic acid hydroxylationCitation39,74.
Figure 3. Correlation between previously reported CYP26 IC50 values using 9-cis-retinoic acid as a probe substrate and IC50 values generated using tazarotenic acid as a probe substrate for CYP26A1 (r2 = 0.78) or CYP26B1 (r2 = 0.62) in vitro activity in recombinant CYP enzymes. Lines represent unity, 3-fold and10-fold difference.
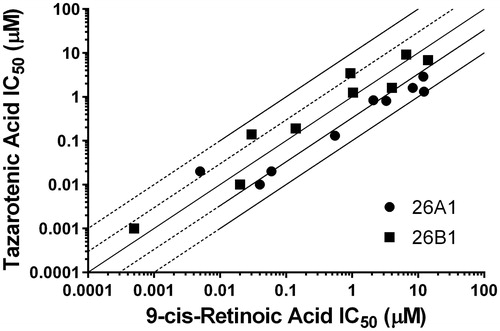
Figure 4. Single concentration (10 μM) inhibition screen using tazarotenic acid as a probe substrate of CYP26 activity. Inhibition values ranged from no inhibition to greater than 90% inhibition.
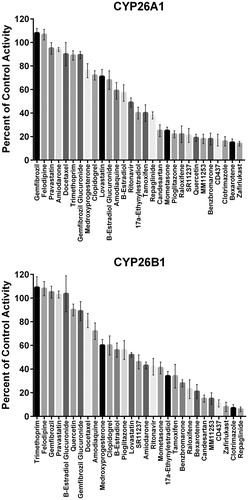
Table 2. IC50 values for tazarotenic acid sulfoxide formation in recombinant CYP26 enzyme preparations by inhibitors of CYP2C8.
Figure 5. In vitro IC50 curves for select CYP26A1 or CYP26B1 inhibitors using tazarotenic acid as a probe substrate. Data points represent the average of incubations conducted in triplicate and IC50 values were calculated using a three-parameter inhibition model with the Hill slope fixed to 1.
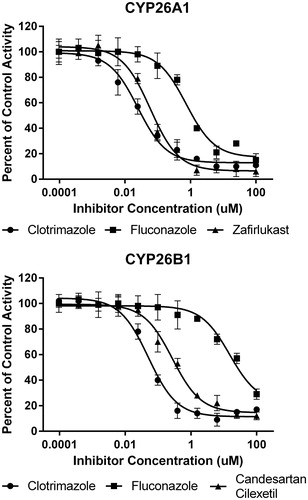
Figure 6. Correlation between previously reported CYP2C8 IC50 values and CYP26A1 (r2 = 0.849) or CYP26B1 (r2 = 0.258) IC50 values generated using tazarotenic acid as a probe substrate. Lines represent unity, 3-fold and10-fold difference.
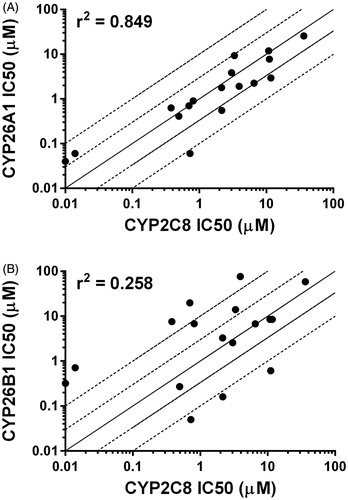
Figure 7. Computational docking of clotrimazole (A, CYP26A1; B, CYP26B1), zafirlukast (C, CYP26A1) and candesartan cilexetil (D, CYP26B1) into the active sites of CYP26. The docking orientation of clotrimazole in the active sites of CYP26A1 and CYP26B1 suggests the potential for the imidazole moiety to inhibit the enzyme through type II binding interactions. Active site residues involved in the binding of zafirlukast in the active site of CYP26A1 (R90, W112, F222 and F299) and candesartan cilexetil in the active site of CYP26B1 (W117, F295, F299 and Y372) are similar to the active site residues known to be involved in retinoic acid binding for each isoform. Portions of the protein structure are not displayed for added clarity.
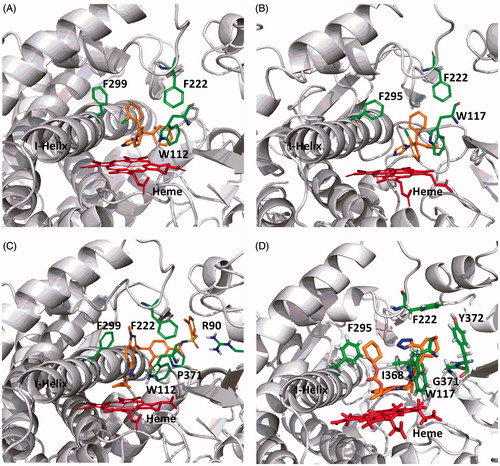
Figure 8. Computational docking of ketoconazole (A, CYP26A1; B, CYP26B1) or R115866 (C, CYP26A1 or D, CYP26B1) supports the reported type II binding interactions observed for CYP26A1 and suggests a similar binding interaction will occur with CYP26B1. The sp2 hybridized nitrogen was located within 3 Å of the heme iron in all cases. Portions of the protein structure are not displayed for added clarity.
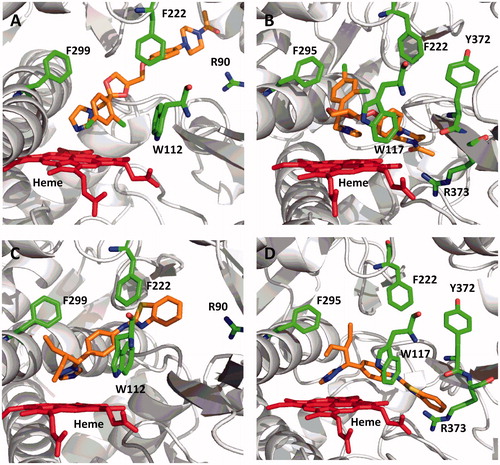
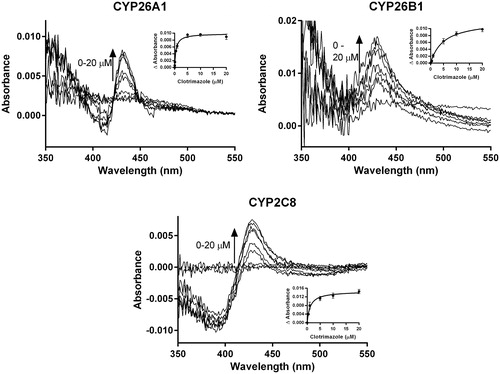
Figure 9. Spectral binding results for clotrimazole with recombinantly expressed CYP26A1, CYP26B1 or CYP2C8, suggesting enzyme inhibition occurs through type II binding interactions with the heme. Ks,unb affinity constants for CYP26A1 (13.3 nM), CYP26B1 (24.7 nM) and CYP2C8 (75.5 nM) were determined through nonlinear regression analysis (inset figures) and corrected for nonspecific binding in the in vitro assays.