
Figures & data
Figure 1. Direct comparison between the EFMAX results obtained using the CD virtual screening (dark grey) and the DDFA approach (grey). The average EFMAX are reported as dotted lines.
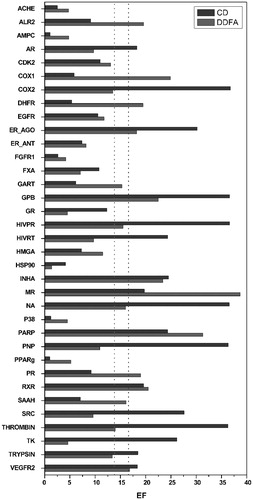
Figure 2. Average EFMAX values obtianed for the DUD dataset by modifying the RMSD cutoff used for pose clustering in the CD calculations.
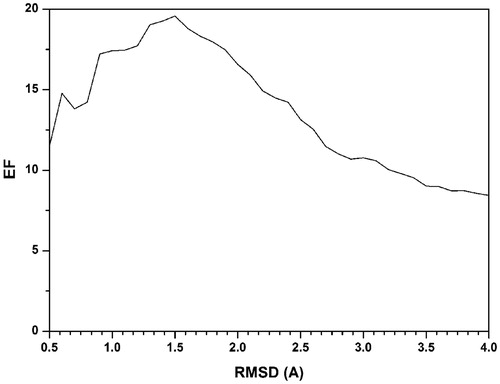
Figure 3. Effect on the aEFMAX obtained by removing a docking method (A) from the initial set of ten docking procedures, (B) in addition to the exclusion of the GOLD-ChemPLP method, (C) in addition to the exclusion of the GOLD-ChemPLP and GLIDE-XP methods. The reference aEFMAX obtained by using the ten docking procedures is reported as a dotted line.
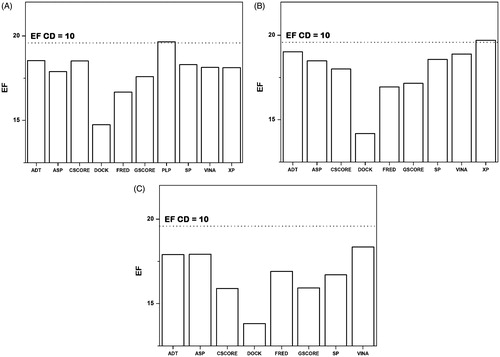
Table 1. Consensus docking results obtained by adding the reported docking procedure to the optimized CD8 protocol (i.e. the combination of the following docking procedures: AUTODOCK, DOCK, FRED, GOLD-ASP, GOLD-CSCORE, GOLD-GSCORE, GLIDE-SP, VINA).
Supplemental material