Figures & data
Scheme 1. Synthesis of the compounds EU1–EU9.
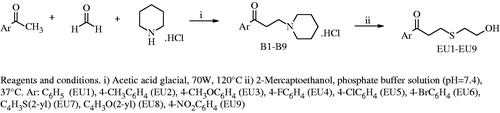
Table 1. Experimental data of the compounds EU1–EU9.
Table 2. Spectral data of the compounds EU1–EU9.
Table 3. Cytotoxic activities of the compounds EU1–EU9.
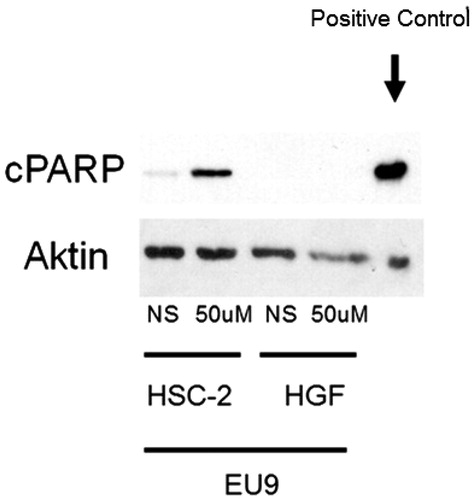
Figure 1. Effect of the compound EU9 on HSC-2 cancer cells and HGF normal cells after. 24 h. (NS means no stimulation (control)).