Figures & data
Figure 1. Catechol-based MMP inhibitors.
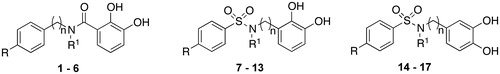
Figure 2. Catechol-based MMP inhibitors.
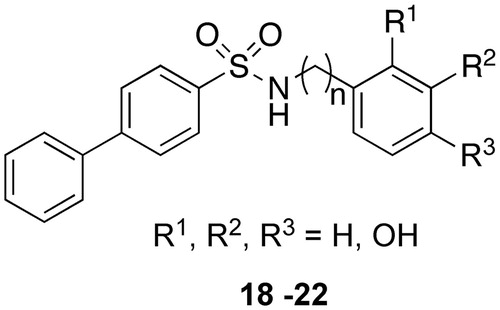
Table 1. MMP activity values expressed as IC50 (μM) and antioxidant activity values expressed as EC50 in DPPH assay and ARP.
Table 2. MMP activity values expressed as IC50 (μM) and antioxidant activity values expressed as EC50 in DPPH assay and ARP.
Scheme 1. Reagents and conditions: (a) anhydrous THF, r.t. or DMAP, DCC, CH2Cl2, r.t.; (b) dry DMF, NaH, CH3I, 0 °C; (c) H2, 10% Pd-C, CH3OH/THF 2:5, r.t.
Figure 3. Hydrogen bond network of the catechol form (A) and the oxidized quinone form (B) of 14 (distances in Å).
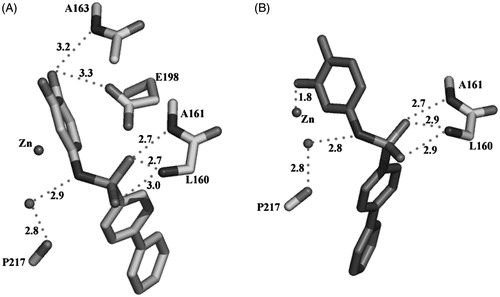
Figure 4. Pharmacophore model on the reference structure 15.
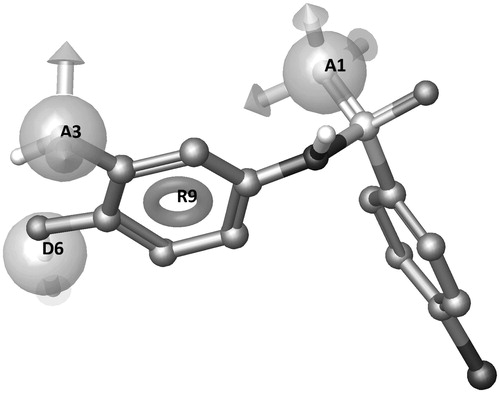
Figure 5. QSAR models for MMP-8 (A), MMP-9 (B), and MMP-2 (C) (test set + training set molecules).
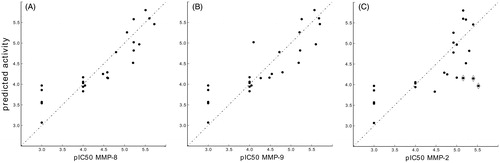
Figure 6. (A) MMP-8:14 X-ray complex (IC50: 3.1 μM, predicted total energy −395 kJ/mol), (B) MMP-2:14 modeled complex (IC50: 7.0 μM, predicted total energy −379 kJ/mol), and (C) MMP-9:14 modeled complex (IC50: 2.7 μM, predicted total energy −405 kJ/mol). The ligand is represented as sticks and the water molecules as spheres. The network of water molecules is depicted with H-bonds reported as dashed lines and water clusters are encircled.
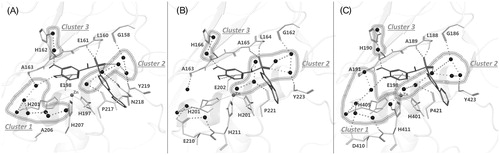
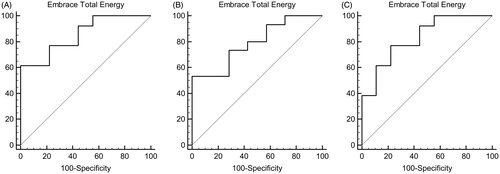
Figure 7. ROC curves (A) MMP-8:14 – AUC: 0.855. (B) MMP-2:14 – AUC: 0.790. (C) MMP-9:14 – AUC: 0.829.
Scheme 2. Reagents and conditions: (a) Et3N, CH2Cl2, reflux; (b) dry DMF, NaH, CH3I, 0 °C; (c) THF/MeOH, 10% Pd/C, H2, r.t. or BBr3, CH2Cl2, 0 °C 1 h.
Scheme 3. Reagents and conditions: (a) Et3N, CH2Cl2, reflux.
Scheme 4. Reagents and conditions: (a) Et3N, CH2Cl2, reflux; (b) BBr3, CH2Cl2, 0 °C 1 h.