Figures & data
Figure 1. Measurements of cytosolic H+ changes in native Xenopus oocytes (B) and oocytes expressing target CA isoform (A, C–H). Cells were injected with 5 ng CA IX-cRNA (A, D, F and H) or 6 ng CA II-cRNA (C, E and G) during application of 5% CO2/25 mM HCO3- (from a nominally CO2-free, HEPES-buffered solution) in the absence of compounds and in the presence of 10 μM VD11-4-2 (C and D), 10 μM VD12-09 (E and F) and 10 μM EA2–3 (G and H). * indicates a significance level of p ≤ 0.05, ** indicate a significance level of p ≤ 0.01, *** indicate a significance level of p ≤ 0.001.
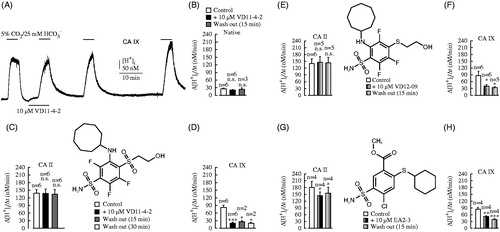
Figure 2. Dose-dependent inhibition of intracellular CA IX catalytic activity with VD11-4-2 in Xenopus oocytes. (A) Recordings of [H+]i in oocytes injected with 5 ng CA IX-cRNA during application of 5% CO2/25 mM HCO3- (from a nominally CO2-free, HEPES-buffered solution) in the absence and presence of 1 nM to 10 μM of VD11-4-2. (B) The dependence of changes in [H+]i on added VD11-4-2 concentrations. Black data points were obtained experimentally. The solid line was simulated according to the Hill model with variable slope.
![Figure 2. Dose-dependent inhibition of intracellular CA IX catalytic activity with VD11-4-2 in Xenopus oocytes. (A) Recordings of [H+]i in oocytes injected with 5 ng CA IX-cRNA during application of 5% CO2/25 mM HCO3- (from a nominally CO2-free, HEPES-buffered solution) in the absence and presence of 1 nM to 10 μM of VD11-4-2. (B) The dependence of changes in [H+]i on added VD11-4-2 concentrations. Black data points were obtained experimentally. The solid line was simulated according to the Hill model with variable slope.](/cms/asset/3e9afdfa-2462-4c3e-a0d2-86e76a7c0842/ienz_a_1217854_f0002_b.jpg)
Figure 3. Measurements of [H+]s in Xenopus oocytes injected with 5 ng CA IX-cRNA (A and C) and native oocytes (B) during application of 5% CO2/25 mM HCO3- (from a nominally CO2-free, HEPES-buffered solution) in the absence and presence of 10 μM VD11-4-2 and after 15 min of washing out. ** indicate a significance level of p ≤ 0.01, *** indicate a significance level of p ≤ 0.001.
![Figure 3. Measurements of [H+]s in Xenopus oocytes injected with 5 ng CA IX-cRNA (A and C) and native oocytes (B) during application of 5% CO2/25 mM HCO3- (from a nominally CO2-free, HEPES-buffered solution) in the absence and presence of 10 μM VD11-4-2 and after 15 min of washing out. ** indicate a significance level of p ≤ 0.01, *** indicate a significance level of p ≤ 0.001.](/cms/asset/6258d655-eb72-4498-808e-911eb595f6ff/ienz_a_1217854_f0003_b.jpg)
Figure 4. Dose-dependent inhibition of extracellular CA IX catalytic activity with VD11-4-2 in Xenopus oocytes. (A) Recordings of [H+]s in oocytes injected with 5 ng CA IX-cRNA during application of 5% CO2/25 mM HCO3- (from a nominally CO2-free, HEPES-buffered solution) in the absence and presence of 0.1 nM to 10 μM of VD11-4-2. (B) The dependence of changes in [H+]s as a function of added VD11-4-2 concentrations. The data points were obtained experimentally while the solid line was simulated according to the Hill model with varying slope.
![Figure 4. Dose-dependent inhibition of extracellular CA IX catalytic activity with VD11-4-2 in Xenopus oocytes. (A) Recordings of [H+]s in oocytes injected with 5 ng CA IX-cRNA during application of 5% CO2/25 mM HCO3- (from a nominally CO2-free, HEPES-buffered solution) in the absence and presence of 0.1 nM to 10 μM of VD11-4-2. (B) The dependence of changes in [H+]s as a function of added VD11-4-2 concentrations. The data points were obtained experimentally while the solid line was simulated according to the Hill model with varying slope.](/cms/asset/57ca7055-c089-4c2e-818d-b67b2c949e40/ienz_a_1217854_f0004_b.jpg)
Figure 5. Measurements of [H+]s in oocytes injected with 1 ng CA IV-cRNA (A) or 5 ng CA XII-cRNA (B) during application of 5% CO2/25 mM HCO3- (from a nominally CO2-free, HEPES-buffered solution) in the absence and presence of 50 nM and 10 μM VD11-4-2 and after 15 min of washing out. ** indicate a significance level of p ≤ 0.01, *** indicate a significance level of p ≤ 0.001.
![Figure 5. Measurements of [H+]s in oocytes injected with 1 ng CA IV-cRNA (A) or 5 ng CA XII-cRNA (B) during application of 5% CO2/25 mM HCO3- (from a nominally CO2-free, HEPES-buffered solution) in the absence and presence of 50 nM and 10 μM VD11-4-2 and after 15 min of washing out. ** indicate a significance level of p ≤ 0.01, *** indicate a significance level of p ≤ 0.001.](/cms/asset/3436169b-792a-4de1-9c9f-8e7404caee52/ienz_a_1217854_f0005_b.jpg)
Figure 6. Recordings of the degradation of 18O-labeled CO2 (A) and evaluations of CA IX activity (B) in the absence and presence of 1 and 10 nM VD11-4-2 in lysed oocytes as measured by mass spectrometry. The addition of oocyte lysate made from 20 cells and different concentrations of VD11-4-2 are shown by arrows. *** indicate a significance level of p ≤ 0.001.
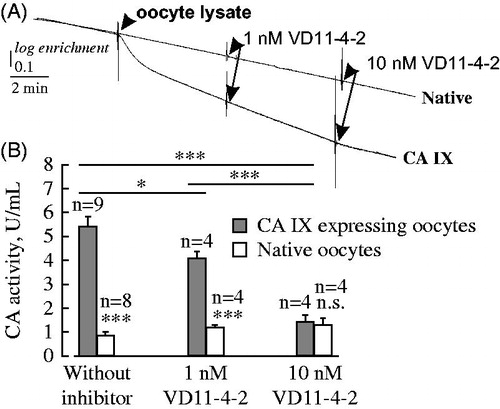
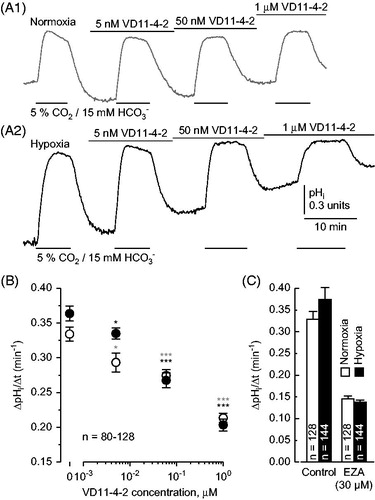
Figure 7. Inhibition of CA activity with VD11-4-2 in MDA-MB-231 breast cancer cells. (A) Recordings of pHi in MDA-MB-231 cells, kept under normoxic (21% O2, A1) or hypoxic (1% O2, A2) conditions, during application of 5% CO2/15 mM HCO3- (pHo 7.2) in the absence and presence of 5 nM, 50 nM and 1 μM of VD11-4-2. (B) Rate of change in pHi in normoxic (white) and hypoxic (black) MDA-MB-231 cells, induced by application of 5% CO2/15 mM HCO3-, as a function of VD11-4-2 concentrations. The asterisks refer to the values in the absence of VD11-4-2. (C) Rate of change in pHi in normoxic (white) and hypoxic (black) MDA-MB-231 cells, induced by application of 5% CO2/15 mM HCO3-, in the absence (control) and presence of 30 μM EZA.