Figures & data
Figure 1. Characterization of the overexpressed PCLI1 protein. (A) The silver-stained gel shows the purified material from mock-transfected and PCLI1_3-transfected NIH3T3 cells. The arrow indicates the overexpressed protein; additional protein bands in the PCLI1 lane (arrowheads 1–7) represent potential interactors of the protein. These proteins were excised from the gel for identification of the potential PCLI1 protein ligands, together with the corresponding areas from the adjacent lane to be subtracted from interactor list. At the bottom, Western blot analysis was carried out to validate the presence of PCLI1 and its ligand, LRP1, in the immunopurified material. (B) The Panel shows the identification data, obtained by MALDI-TOF peptide mass fingerprint analysis of the bands marked by arrowheads in the Panel A. (C) Co-precipitation experiments with GST fusion proteins encompassing the whole cytoplasmic domain of LRP1 (GST-LRP1_Cyt), or with the regions containing both NPXY motifs showed that PCLI1 binds to the whole cytodomain and to the C-terminal NPXY motif in LRP1 (FTNPVY), but not to the N-terminal IGNPTY motif.
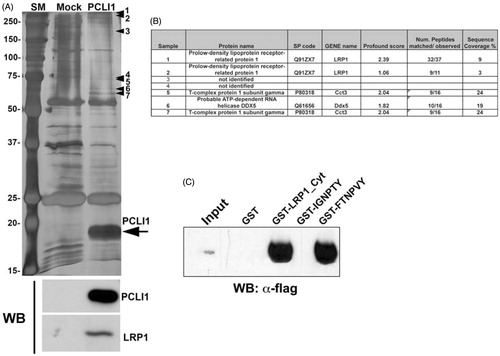
Figure 2. MALDI-TOF MS analysis of phosphorylated PCLI1 peptides. Cropped portion of the spectrum recorded for the enriched phosphopeptide mixture from the PCLI1 digest before (A) and following alkaline phosphatase treatment (B). Signals corresponding to peptide 150–176 in its doubly, singly, and non-phosphorylated forms are indicated (theor. MH+ values at m/z 3044.98, 3124.96 and 3204.94, respectively).
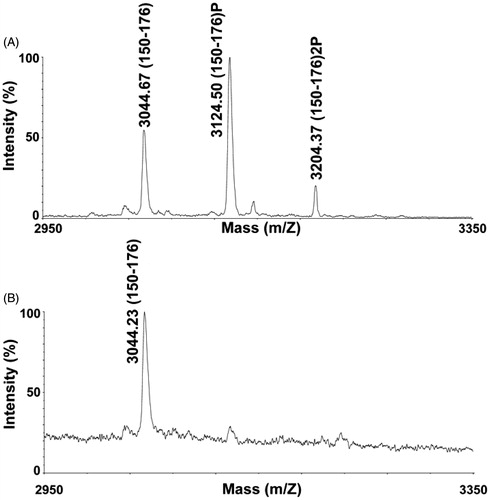
Figure 3. Phosphorylation sites assigned in PCLI1 from NIH3T3 fibroblasts. (A). The fragmentation mass spectrum of the quadruply charged ion at m/z 781.97 (theor. value: 781.55), which was associated with the mono-phosphorylated peptide 150–176 (IHSNSSSEEVSQELESpDDGDYKDDDDK), is shown as ascertained by nanoLC-ESI-LIT-MS/MS analysis. Sp indicates the phosphoserine residue. Fragment b11-b15 and y16-y12 ions (including several yn-98 ones) proved the presence of phosphorylation at Ser165; these fragment ions were shifted by -80 Da as compared with the corresponding ones observed for the non-phosphorylated counterpart (data not shown). (B) The fragmentation mass spectrum of the triply charged ion at m/z 1068.91 (theor. value: 1068.39), which was associated with the di-phosphorylated peptide 150–176 (IHSNSpSSEEVSQELESpDDGDYKDDDDK), is shown as ascertained by nanoLC-ESI-LIT-MS/MS analysis. Fragment b11-b15, y15, y14, and y12 ions (including several yn-98 ones) allowed to assign the phosphate group at Ser165; fragment y22, y23, and b4 ions were suggestive of the occurrence of a phosphate group at Ser154. (C) Sequence alignment of human and mouse PCL1 as limited to the region 150–168, where phosphorylation was ascertained.
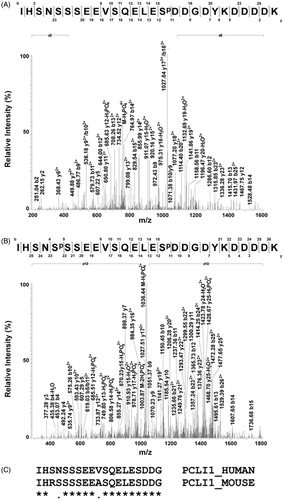
Figure 4. PCLI1 silencing induces decreased proliferation rate in murine cells. (A) Mouse NIH3T3 (black bars) or Neuro2A (white bars) cellular pools were selected after transfection with PCLI1 shRNA-encoding constructs 3A, 4C, 5A, or with a non-silencing (NS) construct. The panel shows the results of Real-Time PCR analysis of PCLI1 transcripts. (B) The proliferation rate of cellular pools of NIH3T3 fibroblasts expressing the PCLI1 5A shRNA construct was lower, compared to wild-type NIH3T3 fibroblasts or to cellular pools of NIH3T3 expressing the non-silencing shNS construct. Cells, collected at the indicated time-points, were assayed for metabolic activity with the Alamar blue assay (see Experimental Procedures for details). (C) The proliferation rate of cellular pools of Neuro2A cells expressing the PCLI1 5A shRNA construct was lower, compared to wild-type Neuro2A or to cellular pools of Neuro2A expressing the non-silencing shNS construct. Cells, collected at the indicated time-points, were assayed for metabolic activity with the Alamar Blue assay. (D) Exponentially growing cultures of wild-type NIH3T3, shNS, and shPCLI1 cells were subjected to FACS analysis to evaluate their distribution in the G0/G1, S, and G2/M phases of the cell cycle, according to their DNA content. The experiment was performed on three biological replicates, with very similar results; reported data refer to a representative experiment.
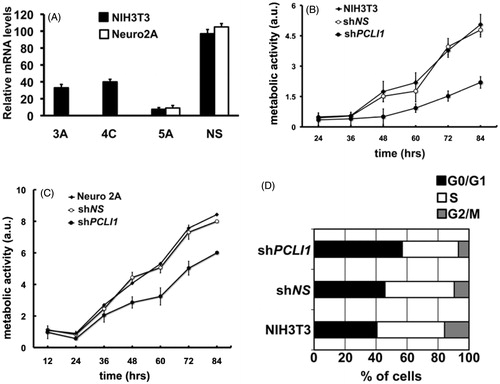
Figure 5. PCLI1 silencing induces accumulation of cells in G1 phase of the cell cycle. Wild-type NIH3T3 fibroblasts and cellular pools of NIH3T3 expressing the non-silencing (shNS) or the PCLI1 (shPCLI1) constructs were synchronized by serum deprivation (starved cells) and allowed to start cell cycle by serum re-addition for 10, 12, or 16 h. The chart reports the distribution of cells in the G0/G1, S, and G2/M phases of cell cycle of a representative experiment, according to their DNA content. The experiment was performed on three biological replicates, with very similar results; reported data refer to a representative experiment.
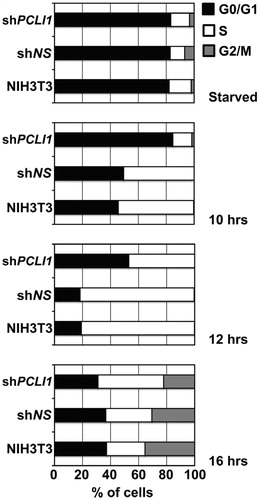
Table 1. Cell cycle distribution of exponentially growing or synchronized (12 h after serum stimulation) parental NIH3T3 cells and cellular pools for non-silencing and PCLI1-silencing constructs.
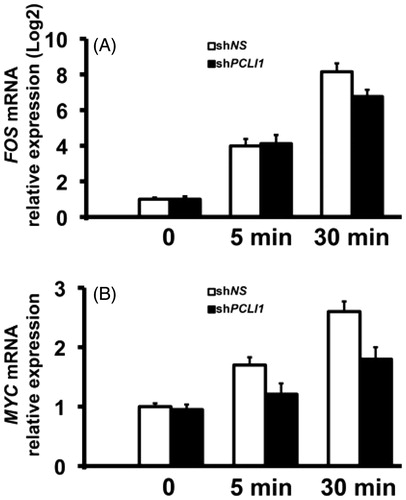
Figure 6. PCLI1 modulates expression of FOS and MYC transcripts in the early G1 phase of NIH3T3 fibroblasts. shNS or shPCLI1 cells were serum-starved and stimulated for the indicated time-points with serum. The resulting RNA samples were tested in triplicate Real-Time PCR experiments for FOS and MYC transcripts. The corresponding mRNA levels were normalized to β-actin mRNA levels.