Figures & data
Table 1. IC50 values (μM) of inhibitors against human 5, 12, 15-LOXs.
Figure 1. Inhibitory activities of 1 and 2 against 5-, 12-, 15-LOXs. Lineweaver–Burk plots of LOXs inhibition by 1 and 2. The panel shows the representative double reciprocal plots of 1/v vs 1/S at various compound concentrations. 1: (A) (5-LOX); (B) (12-LOX); (C) (15-LOX). 2: (D) (5-LOX); (E) (12-LOX); (F) (15-LOX).
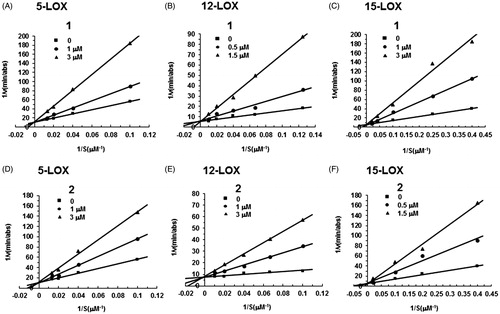
Figure 2. Compound 1 is a redox-active inhibitor of LOXs. This figure shows the radical scavenging activity of compound 1. Various amounts of 1 were incubated with 10 nmoles DPPH in 100 μl EtOH for 30 min in the dark and the absorbance at 520 nm was recorded. All data are represent as mean ± SD.
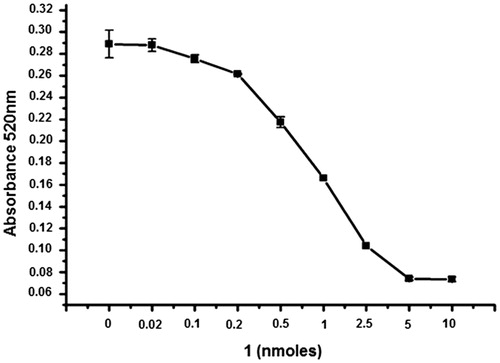
Figure 3. Effect of 1 on LTB4 generation in neutrophils. Isolated mouse neutrophils were pretreated with various concentrations of 1 for 30 min, then simulated with A23187 (10 μM) for another 30 min. LTB4 levels in the supernatant were determined by a commercial ELISA kit. NDGA (10 μM) was used as a positive control. All data are represent as mean ± SD. *p < 0.05, **p < 0.01, ***p < 0.001. p Values were obtained by the one-way ANOVA test.
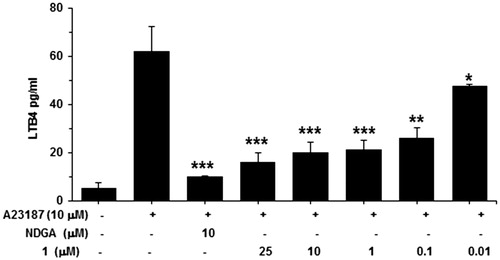
Figure 4. Effect of 1 on fMLP-induced neutrophils migration. Neutrophils isolated from the bone marrow of mouse were pretreated with various concentrations of 1 for 30 min and then simulated with fMLP (5 μM) for 37 °C for 1 h using a 96-well chemotaxis plate with 3 μm pore diameter. Migrated cells were collected and counted. NDGA (10 μM) was used as a positive control. All data are represented as mean ± SD. **p < 0.01, ***p < 0.001. p Values were obtained by the one-way ANOVA test.
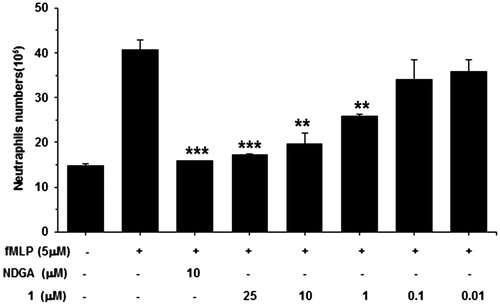
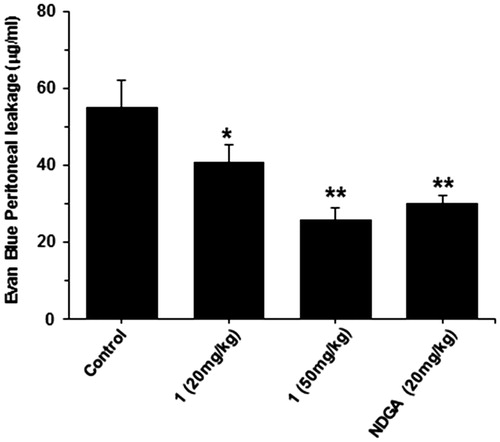
Figure 5. Effect of 1 (20 mg/kg and 50 mg/kg, i.p.) on acetic-acid-induced vascular permeability test in ICR mice. NDGA serves as a positive control (20 mg/kg, i.p.). All data are represented as mean ± SD (n = 6). *p < 0.05, **p < 0.01. p Values obtained performed by the one-way ANOVA test.