Figures & data
Figure 1. Schemes of the syntheses of hydroxymate-containing compounds. (A) The scheme of the synthesis of 3-(heptyloxy)-N-hydroxybenzamide (compound 4). (B) The scheme of the synthesis of N-hydroxy-3-((6-(hydroxyamino)-6-oxohexyl)oxy)benzamide (compound 7).
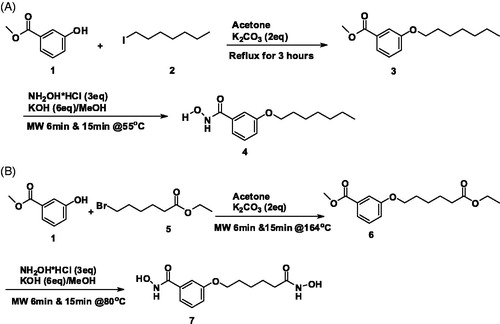
Figure 2. Concentration–response plots for Bla2 inhibition with compound 7.
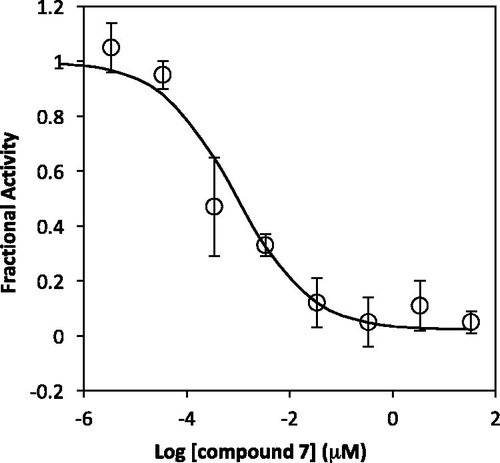
Figure 3. Lineweaver–Burke plots of inhibition of Bla2 y compound 7. The concentrations of compound 7 are 0 (circle), 0.5 (square), and 1.0 μM (triangle). Assays were performed in 50 mM MOPS, pH 7.0. Kinetic constants were determined by fitting of the data to the equation v = VmaxS/[Km·(1 + 1/Ki) + S] which indicates competitive inhibition.
![Figure 3. Lineweaver–Burke plots of inhibition of Bla2 y compound 7. The concentrations of compound 7 are 0 (circle), 0.5 (square), and 1.0 μM (triangle). Assays were performed in 50 mM MOPS, pH 7.0. Kinetic constants were determined by fitting of the data to the equation v = VmaxS/[Km·(1 + 1/Ki) + S] which indicates competitive inhibition.](/cms/asset/867520c4-dcd7-4904-a741-a4a39fa7e628/ienz_a_1222580_f0003_b.jpg)
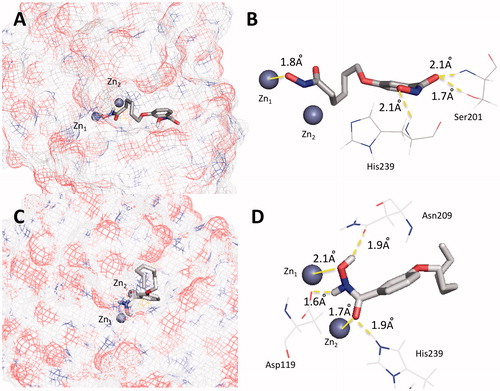
Figure 4. Molecular docking between Bla2 and the compounds (4 and 7). (A and B) A snapshot of binding mode of compound 7 and Bla2. (C and D) A snapshot of binding mode of compound 4 and Bla2.