Figures & data
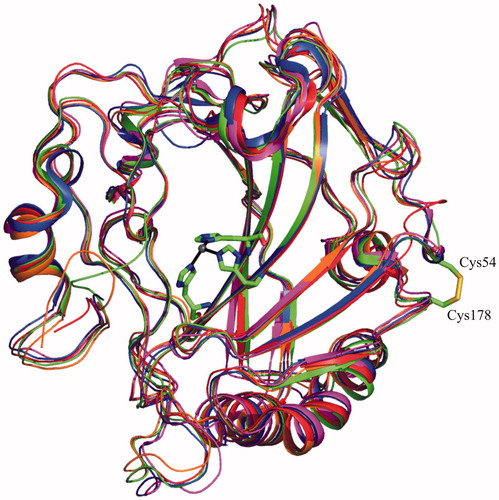
Figure 1. Multiple sequence alignment of cytosolic CAs. All cysteine residues are indicated with an asterisk; the reactive cysteines of isoforms III and VII are highlighted in dark gray, whereas those involved into hCA VII intramolecular disulfide bridge are highlighted in light gray. The sequence of bovine (b), rat (r) and human (h) CA III are reported showing that all cysteine residues are conserved. The alignment has been performed using Clustal Omega serverCitation84.
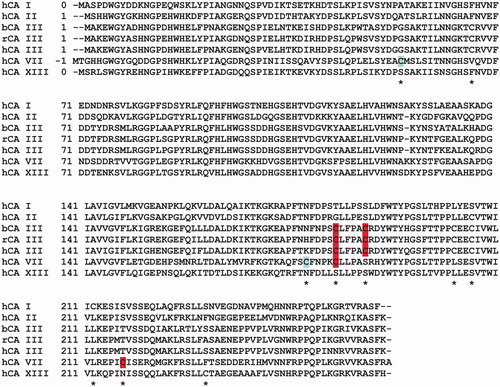
Scheme 1. Schematic representation of reversible and irreversible oxidation of CA III reactive cysteines.
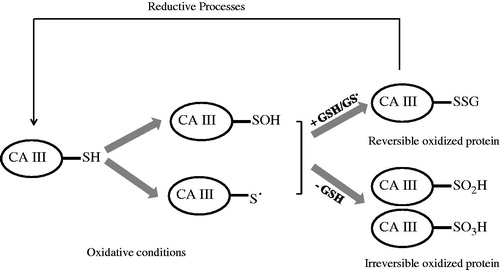
Figure 2. Quantitative analysis of apoptotic marker levels in transfected HeLa cells after treatment with SA for 16 h. In each histogram, the protein intensity level was normalized to endogenous actin and expressed as percentage with respect to untreated cells. Black histograms refer to procaspase-3 levels, gray histograms to Bcl-2 and white histograms to Bax levels.
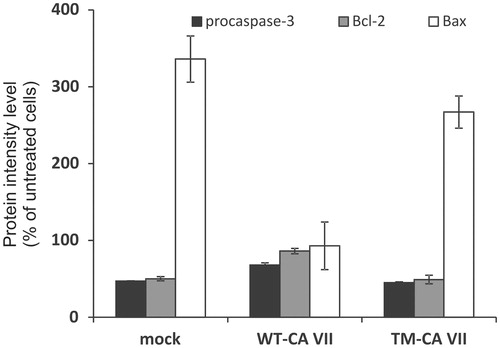
Figure 3. Ribbon representation of the overall fold of CA III.
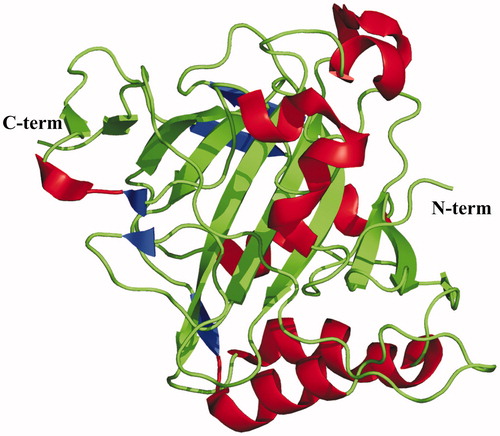
Figure 4. Schematic representation of (A) Cys188-GSH adducts and (B) Cys183-GSH. The two Cys183 conformers are indicated as 1 and 2. Surface representation of CA III is also reported showing the positive charged residues (Lys and Arg) colored light gray, while negative ones (Asp and Glu) colored black.
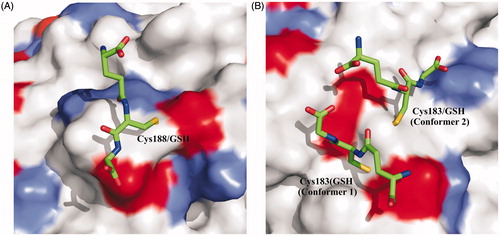
Figure 5. Structural superposition of all cytosolic ?-CAs. The zinc ion coordination and intramolecular disulfide bridge of hCA VII are also depicted.