
Figures & data
Figure 1. Structure of compounds 1–9 derived from A. vera.
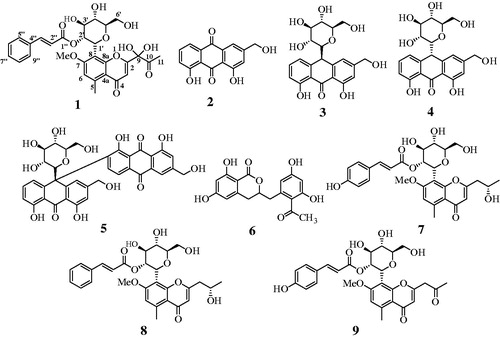
Figure 2. Key HMBC (→) and COSY (-) correlations of compound 1.
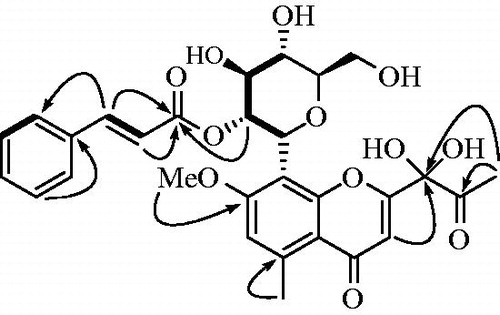
Table 1. 1H and 13C-NMR data for compound 1.
Figure 3. (A) Inhibitory activity of compound 9 on tyrosinase (IC50: 9.8 ± 0.9 μM; kojic acid =19.5 ± 1.5 μM). (B) Relationship of the hydrolytic activity of tyrosinase with enzyme concentration at a variety of inhibitor concentration. (C) Lineweaver–Burk plot (Competitive type) and (D) Dixon plot (Ki: 5.8 ± 0.9 μM) for the inhibition of compound 9.
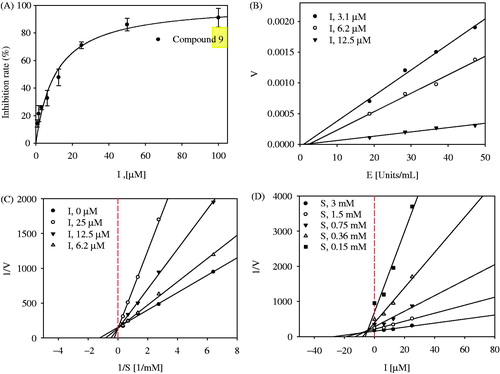
Table 2. Inhibition rate of isolated compounds 1–9 on tyrosinase and PMMoV.
Figure 4. Docking pose of 9 at the lowest energy with enzyme indicated as ribbon (A). The green dotted line represents hydrogen-bond interactions between compound 9 and enzyme (B).
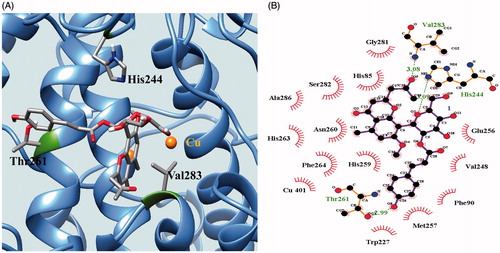
Table 3. Interaction and Autodock score on tyrosinase of 9.