
Figures & data
Scheme 1. Synthetic pathway to the sulfonamides 8a–i. Reagents and conditions: (a) CH3CH2NO2, KOH, DMSO, 2 h, 80–86%; (b) Na2S2O4, H2O/dioxane, rt, 12 h, 55–65%; (c) CH3NH–NH2, PTSA, EtOH, rt, 1 h, 50–55%; (d) method A: 10% HCl, EtOH, reflux, 1 h, 58–61%; method B: PTSA, 140 °C, 1 min, 61%; (e) ethoxyphenylboronic acid, Pd(PPh3)4, CuMeSal, THF, Ar, reflux, overnight, 75–80%; (f); ClSO3H, 0 °C to rt, 2 h, 75–95%; (g) appropriate amine, anhydrous MeCN, rt, overnight, 72–93%.
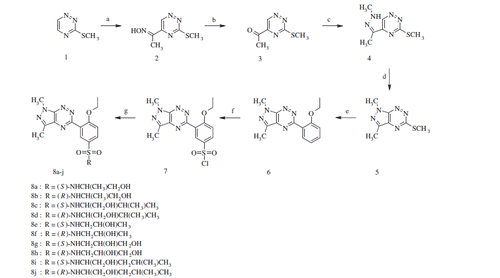
Table 1. The inhibitory effects of compounds 8a–8j on mushroom tyrosinase and urease.
Figure 1. a) Lineweaver–Burk plots for the inhibition of mushroom tyrosinase in the presence of compound (8b). Concentrations of (8b) were 0, 15, 30, 61, 123 and 247 μM, respectively. Substrate l-DOPA Concentrations were 0.125, 0.25, 0.5, 1 and 2 mM, respectively. b) The secondary replot of the Lineweaver–Burk plot, 1/V (y-intercept) of a) versus various concentrations of (8b). c) The Dixon plot of the reciprocal of the initial velocities versus various concentrations of compound (8b) at fixed substrate concentration.
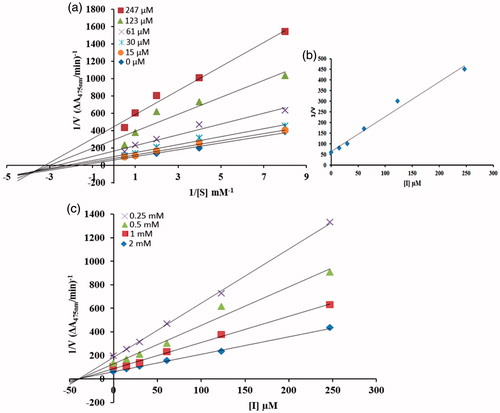
Figure 2. a) Lineweaver–Burk plots for the inhibition of mushroom tyrosinase in the presence of compound (8j). Concentrations of (8j) were 0, 14, 28 and 55.8 μM, respectively. Substrate l-DOPA Concentrations were 0.062, 0.125, 0.25, 0.5, 1 and 2 mM, respectively. b) The Dixon plot of the reciprocal of initial velocities versus various concentrations of compound (8j) at fixed substrate concentration.
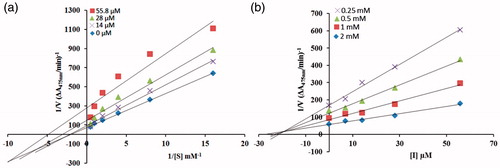
Figure 3. a) Double reciprocal Lineweaver–Burk plots for the inhibition of Jack bean urease in the presence of compound (8a). Concentrations of (8a) were 0, 0.125, 0.25 and 0.5 μM, respectively. Substrate urea concentrations were 3.12, 6.25, 12.5, 25, 50 and 100 mM, respectively. b) The secondary replot of the Lineweaver–Burk plot, 1/V (y-intercept) of a) versus various concentrations of (8a). c) The Dixon plot of the reciprocal of the initial velocities versus various concentrations of compound (8a) at fixed substrate concentration.
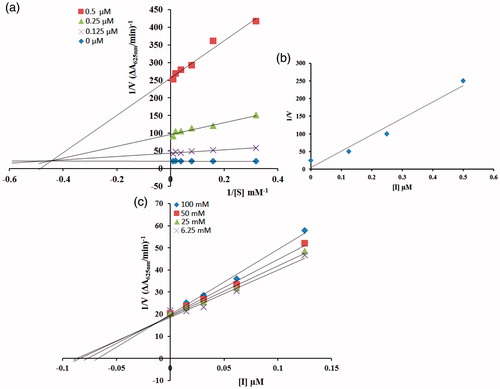
Table 2. Inhibitory effect of compound 8b and 8j on mushroom tyrosinase activity and of 8a on urease activity.