
Figures & data
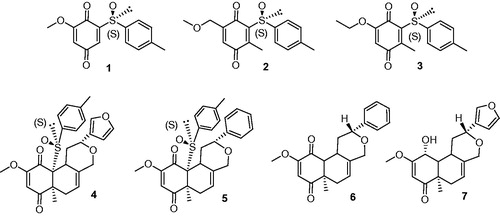
Figure 1. Quinones and quinone-like compounds 1–7.
Scheme 1. Preparation of the quinone 1 from vanillin.
Scheme 2. Preparation of the quinones 2 and 3 from 2-methylhydroquinone.
Figure 2. Preliminary screening of the test-set. The inhibition of CDC25A (left/blue bars), CDC25B (middle/green bars), and CDC25C (right/red bars) isoforms by 100 μM of 1–7 was evaluated. DMSO served as negative inhibition control (100% residual CDC25 activity), while the reference inhibitor naphtoquinone at 20 μM serve as positive control.
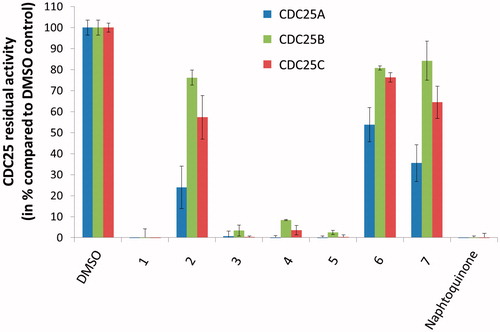
Table 1. Inhibition of human CDC25 isoforms by quinones and quinone-like compounds 1, and 3–5.
Figure 3. Predicted binding mode of active molecules 1, 3, 4 and 5 towards the crystallographic structure of CDC25A (Panel A), CDC25B (Panel B), and the homology model of CDC25C catalytic domain (Panel C). Small molecules are shown as sticks. The protein is shown as cartoon. Side chains of residues within 5 Å from small molecules are showed as lines. H-bond interactions are highlighted by dashed lines, and residues contacted by H-bonds are labeled. For the sake of representation, H atoms were omitted. The catalytic cysteine residue is shown as sticks and is labeled.
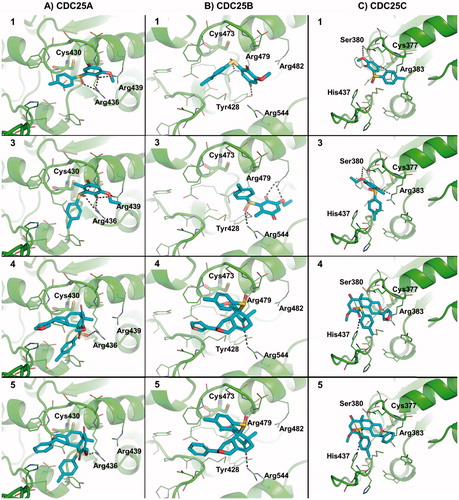
Table 2. Predicted binding affinity of active molecules towards CDC25A, CDC25B and CDC25C.