
Figures & data
Figure 1. Best docking pose found between chlorogenic acid and tyrosinase (A), α-glucosidase (B), butyrylcholinesterase (C) and a-amylase (D).
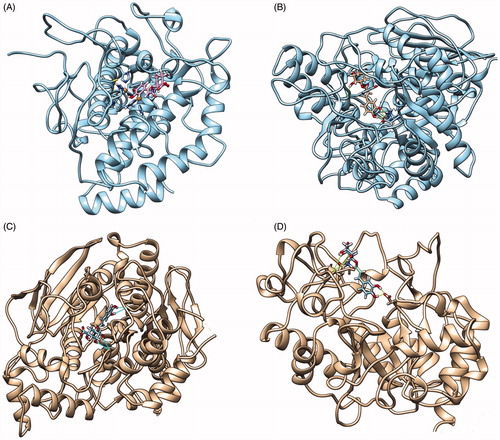
Figure 2. Total phenolic and flavonoid contents of the three extracts from Lycium barbarum leaves (mean ± SD).
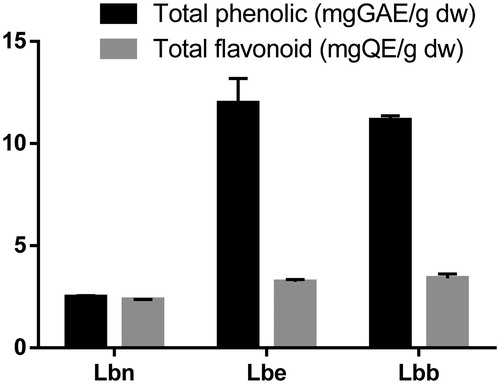
Figure 3. LC-DAD chromatogram (at 325 nm) of the phenolic compounds from L. barbarum leaves (cultivar Lbb- "Bigligeberry"). For compounds numbers refer to .
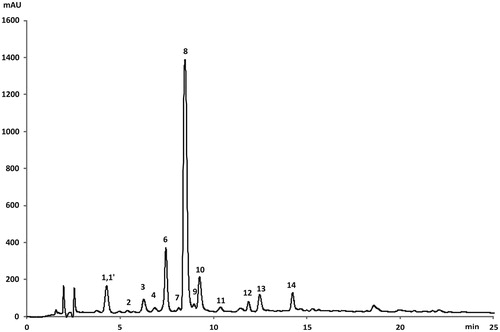
Table 1. Phenolic compounds in Lycium barbarum leaves, retention times (Rt), wavelengths of maximum absorption (λmax), mass spectral data and identification.
Table 2. Phenolic compounds (μg/g dw) and their distribution in Lycium barbarum leaves (mean ± SD).
Figure 4. Total antioxidant capacity of Lycium barbarum leaves measured with TEAC and EPR spectroscopy. Results were expressed as mg TE/g dw, and as mg FSE/g dw. The error bars are the result of a triple determination.
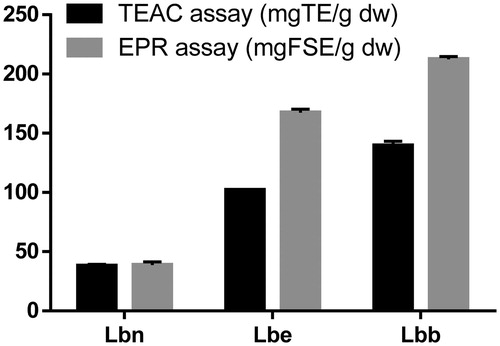
Figure 5. Degradation kinetics of the free radical Fremy’s salt by Lycium leaves.
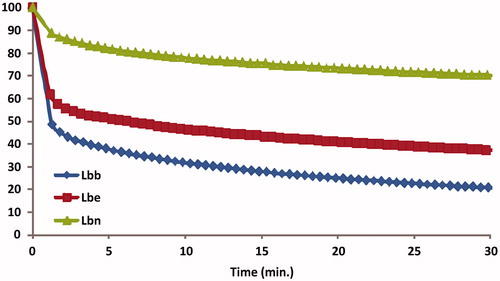
Table 3. The enzyme inhibitory effects of Lycium leaves.
Figure 6. Binding interactions of the best pose of chlorogenic acid in complex with: α-glucosidase (A), butyrylcholinesterase (B), and α-amylase (C) (cut-off 4 Å).
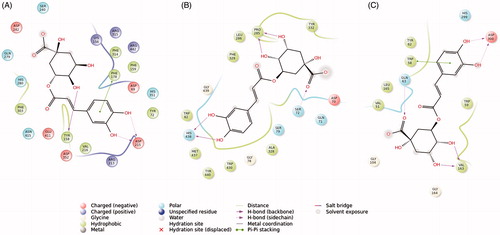
Figure 7. RMSD (in Angstrom) time-dependent plot of chlorogenic acid fluctuation docked to tyrosinase (A); close-up of the complex chlorogenic acid-tyrosinase (hydrogen bonds are reported as green lines) (B); details of the interactions formed by chlorogenic acid with the residues present in the binding pocket (cut-off = 4 Å from the ligand) (C).
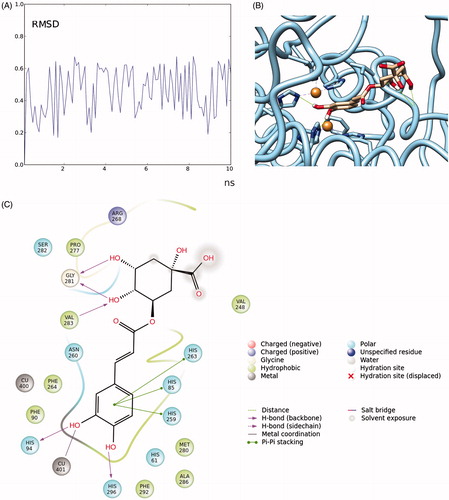
Table 4. Antimicrobial activity of the three Lycium leaves extracts.
Table 5. Antimutagenic properties of Lycium leaves extracts on Salmonella typhimurium TA 98 and TA 100.