Figures & data
Figure 1. Chemical structure of the ligands BMY-7378, WAY-100635 and the related α1-ADR and 5-HT1A affinity values.
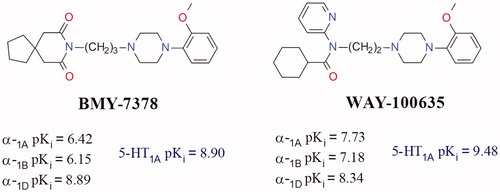
Table 1. Chemical structures of compounds 1–42 (Group A).
Table 2. Chemical structure of compounds 43–91 (Group B).
Figure 2. Schematic representation of the library members.
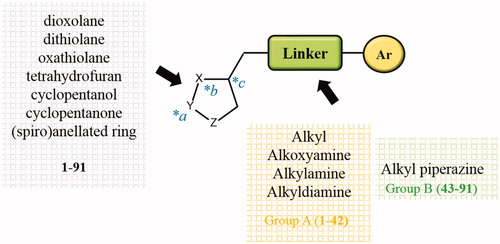
Figure 3. Distribution of the experimental-based weighted affinity and of the experimental ones of the dataset compounds.
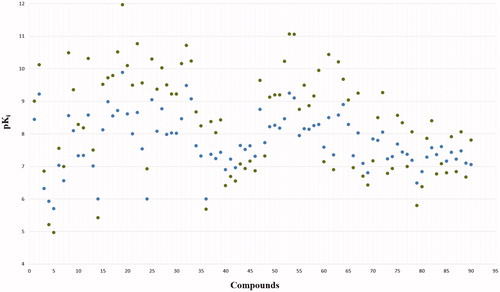
Table 3. Summary of CoMFA and CoMSIA analyses calculated as Models I and II.
Figure 4. Distribution of the predicted weighted pKi values (p-w. pKi) with respect to the experimental-based pKi (e-w. pKi) of the training set compounds and of the test set compounds according to Model I CoMFA (a) and CoMSIA (b) analyses.
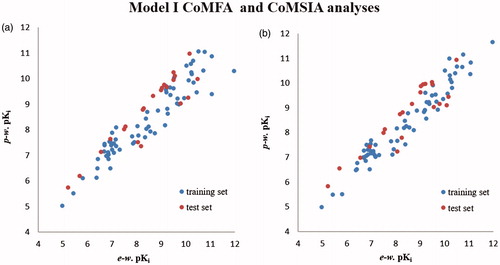
Figure 5. Distribution of the predicted pKi values of training set compounds and of the test set compounds with respect to the experimental data according to Model II CoMFA (a) and CoMSIA (b) analyses.
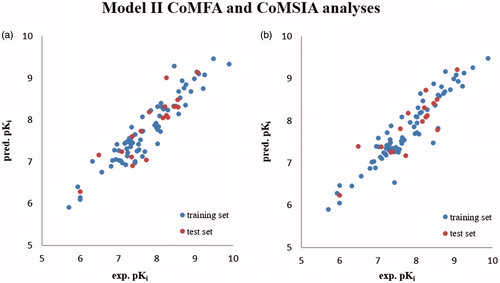
Figure 6. Contour map of Model I CoMFA steric regions are shown around the compounds 12 and 39 (a) and 52, 67 (b) while those of the electrostatic map are shown in (c) and (d).
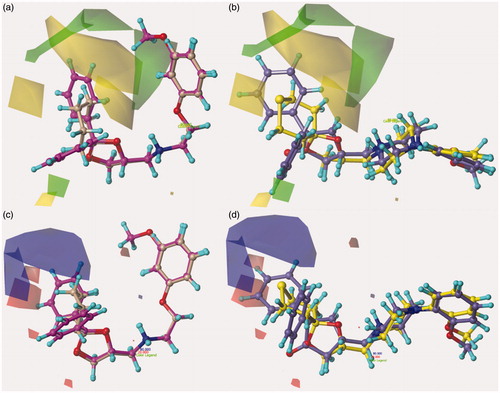
Figure 7. Model I CoMSIA hydrophobic favoured and disfavoured (white area) regions are shown around 12 and 39 (a) and 52, 67 (b). The compounds are displayed in ball and stick mode.
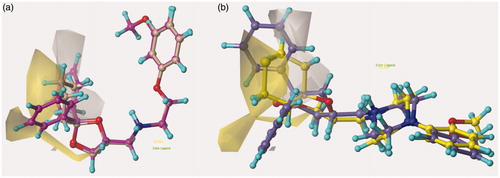
Chart 1. Contour maps of Model II CoMFA model steric and electrostatic regions are shown for Group A 19, 39 and Group B 53 cis, 67.
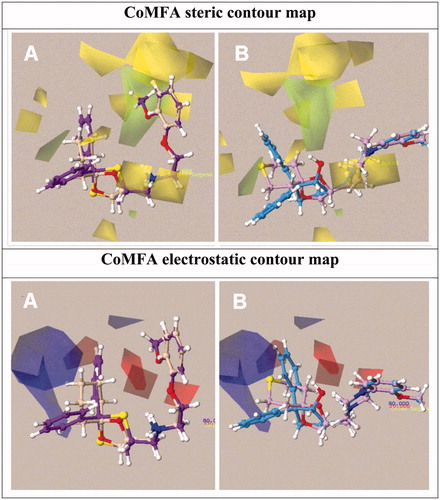
Chart 2. Contour maps of Model II CoMSIA model hydrophobic, H-bond acceptor and H-bond donor descriptors are shown. Compounds 19, 39 and 53 cis, 67 are depicted.
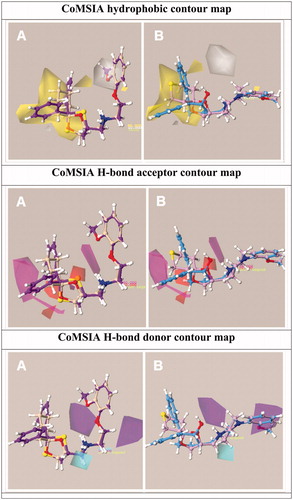
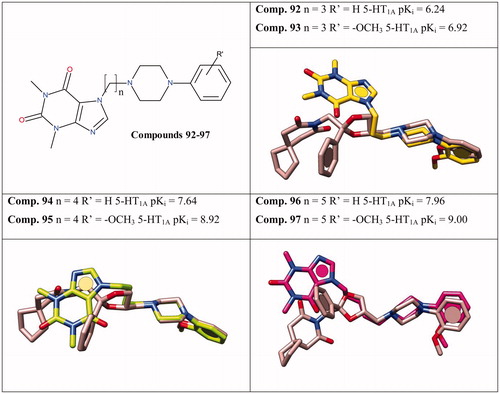
Chart 3. Superimpositions of the in-house derivative 63 cis and the external set compounds 93, 95 and 97 are depicted. The chemical structure and the 5-HT1A affinity values for 92–97 are also shown.