
Figures & data
Figure 1. Syntheses of all compounds (a for SMABT and b for 1 and c for 2–4 and d for 5).
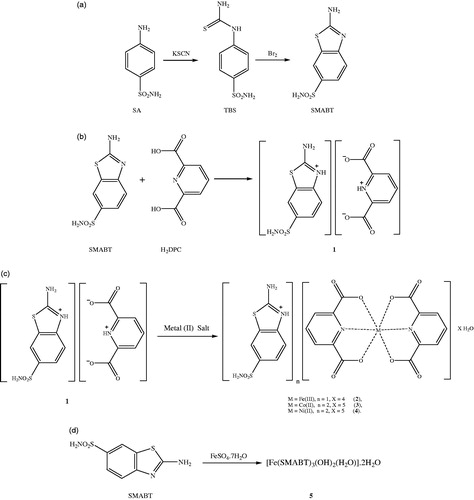
Table 1. Crystal data and structure refinement details for compounds 2–4.
Figure 2. An ORTEP drawing of asymmetric unit of 2 with the atom-numbering scheme. Displacement ellipsoids are drawn at the 40% probability level.
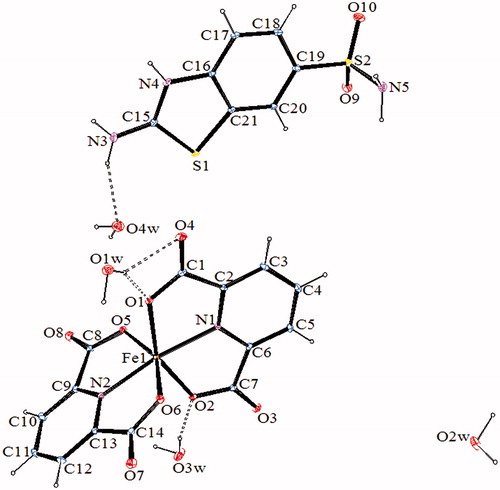
Figure 3. An ORTEP drawing of asymmetric unit of 3 with the atom-numbering scheme. Displacement ellipsoids are drawn at the 40% probability level.
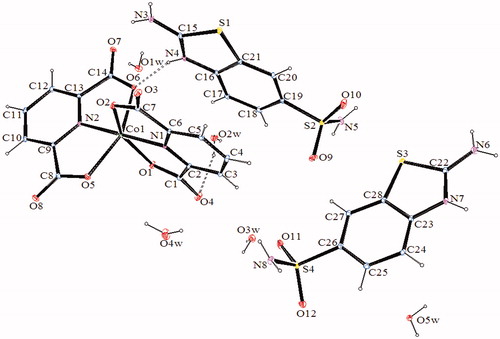
Figure 4. An ORTEP drawing of asymmetric unit of 4 with the atom-numbering scheme. Displacement ellipsoids are drawn at the 40% probability level.
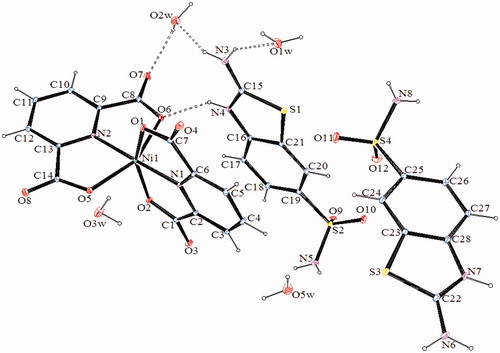
Table 2. Selected bond distances [Å] and angles [°] of compounds 2–4.
Table 3. Hydrogen bonds for compounds 2–4 (Å, °).
Table 4. 1H-NMR and 13C-NMR chemical shifts (ppm) with coupling constants and assignments for compound 1.
Table 5. The inhibition data and Ki values of hCA I and hCA II isozymes for hydratase and esterase activity.