Figures & data
Scheme 1. Preparation of compounds 2 and 3. (a) Benzoyl chloride, TEA, dry DCM, 0 °C to rt, 22 h; (b) acetyl chloride, TEA, dry DCM, 0 °C to rt, 6 h.
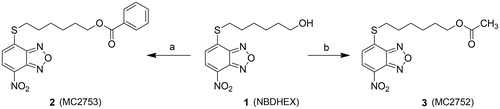
Figure 1. Inhibition of GSTP1-1 by NBD derivatives. Inhibition curves of GSTP1-1 by 2 (A) or 1 (B) dissolved in buffer A (pH 6.5), at 25 °C. Inhibition curves of GSTP1-1 by 2 (C) or 3 (D), dissolved in buffer B (pH 6.5), at 25 °C. Data points represent the mean ± SD from three independent experiments. Error bars smaller than the symbols are not visible. Calculated Kiapp values for each condition are reported.
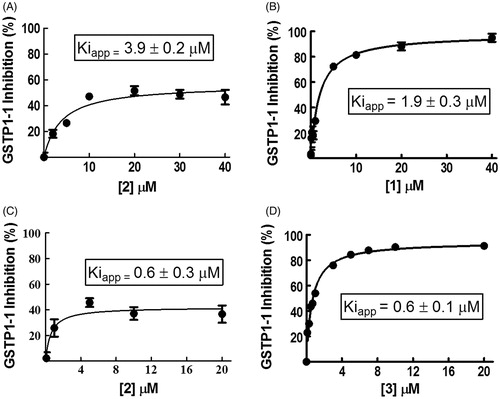
Figure 2. Evaluation of 1 and 2 reactivity with GSH in the absence or in the presence of GSTP1-1. Spectrophotometric analysis. UV–visible spectra of 20 μM 1 (left) and 2 (right) dissolved in buffer A, pH 6.5, recorded at 25 °C (panels A and C) or dissolved in buffer A, pH 7.4, recorded at 37 °C (panels B and D), before and at different times (0–60 min) after the addition of 1 mM GSH (panels A and B) or 1 mM GSH and 20 μM of GSTP1-1 (panels C and D).
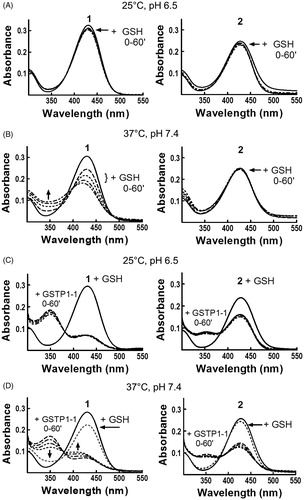
Figure 3. Spectrofluorometric analysis of the interaction between 1 or 2 and GSTP1-1. The emission spectra of (A) 1 (4 μM) and (B) 2 (4 μM), dissolved in buffer A (pH 6.5), were recorded at 25 °C before and after the addition of increasing amounts of GSTP1-1 (1–20 μM), in the absence (left) or in the presence (right) of 1 mM GSH. (C) The emission spectrum of GSTP1-1 (4 μM in buffer B, pH 6.5) was recorded at 25 °C before and after the addition of 2 (20 μM), in the absence (left) or in the presence (right) of 1 mM GSH.
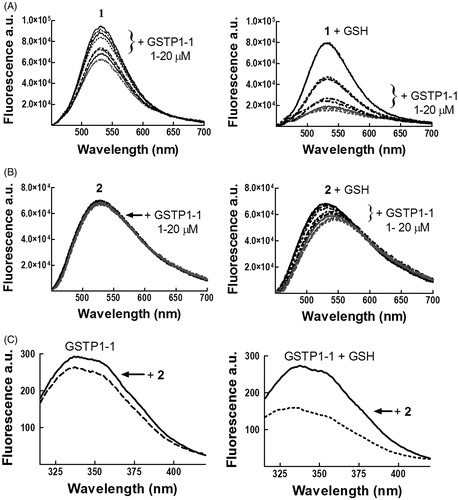
Figure 4. Co-inhibition experiments involving 1 and 2. Inhibition of GSTP1-1 activity was evaluated at 25 °C and pH 6.5, in the presence of both 1 and 2 in a concentration range between 0.1 and 10 μM. The substrates GSH and CDNB were kept constant at 1 mM. Data points represent the mean ± SD from three independent experiments. Error bars smaller than the symbols are not visible.
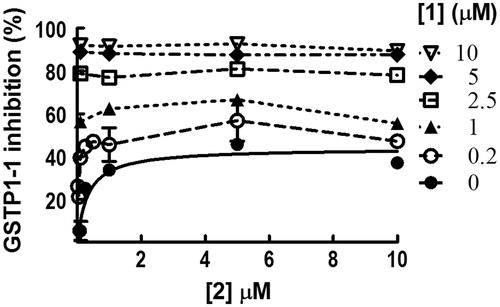
Figure 5. Effect of 1 and 2 on TRAF2–GSTP1-1 interaction. (A) His-tagged TRAF2 (0.005 μM) was immobilized on Ni-NTA-coated plates and incubated with increasing amounts of GSTP1-1 (from 0.1 to 8 μM) in the absence (-•-) or in the presence of 8 μM 1 (-□-) or 20 μM 2 (-Δ-), and 1 mM GSH. (B) The same experiment as in (A), performed in the absence of GSH. Data points represent the mean ± SD from three independent experiments. Error bars smaller than the symbols are not visible.
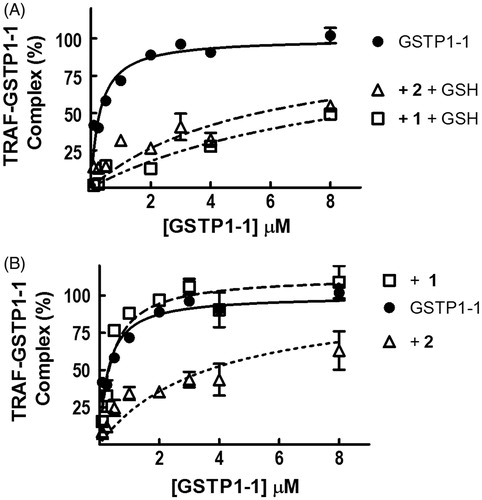
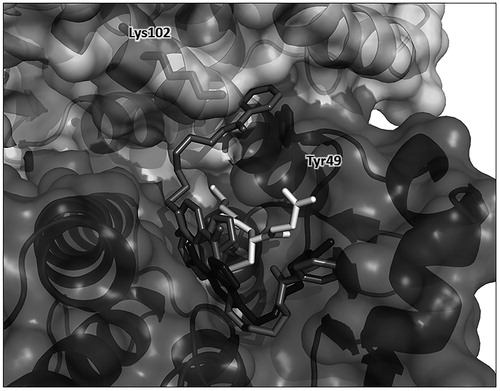
Figure 6. Protein–ligand docking analysis. Two docking-obtained orientations for 2 (in medium grey); GSH is in white, residues Tyr49 from monomer A and Lys102 from monomer B are shown in sticks inside the protein surface and labeled for clarity. For comparison, the position of 1 in the crystal structure is also shown in dark grey. Ribbon and surface representation of the remaining part of the protein is shown with subunit A (bottom, darker surface) and subunit B (top, ligther surface).