Figures & data
Figure 1. Previously reported pyrazolo[4,3-d]pyrimidines A–C and triazolotriazines ZM-241385 and D.
![Figure 1. Previously reported pyrazolo[4,3-d]pyrimidines A–C and triazolotriazines ZM-241385 and D.](/cms/asset/af20bc73-e895-4001-8741-498c47c284a0/ienz_a_1247060_f0001_b.jpg)
Figure 2. Herein reported pyrazolo[4,3-d]pyrimidine derivatives 1–24.
![Figure 2. Herein reported pyrazolo[4,3-d]pyrimidine derivatives 1–24.](/cms/asset/492ddf9c-d845-4aa5-a55a-23b66f536e8f/ienz_a_1247060_f0002_b.jpg)
Scheme 1. Reagents and conditions: (a) Ph-B(OH)2, Cu(OAc)2, pyridine, CH2Cl2, 4 Å molecular sieves, room temperature; (b) MeI or PhCH2Br, NaH, anhydrous THF, room temperature; (c) cyclohexene, Pd/C, 150 °C, mw; (d) R–N=C=S, DMF, room temperature; (e) 0.1 M aqueous NaOH, CH3I, room temperature; (f) NH4Cl, formamide, 110–150 °C mw; (g) compounds 2, 11, 12, BBr3, anhydrous CH2Cl2, room temperature or reflux.
Scheme 2. Reagents and conditions: (a) N,N-dimethylaniline, POCl3, 150 °C, mw; (b) 33% aqueous NH3, 100 °C, mw; (c) benzylamine, ethyldiisopropylamine, tert-butanol, 200 °C, mw; (d) ethyldiisopropylamine, N-methylpyrrolidone, 130–150 °C, mw; (e) compound 20, LiAlH4, anhydrous THF, room temperature.
Scheme 3. Reagents and conditions: (a) CF3COOH, CH2Cl2, reflux; (b) RCOCl, NEt3, anhydrous THF, room temperature.
Table 1. Binding affinity at hA1, hA2A and hA3 ARs and potencies at hA2B ARs.
Table 2. Binding affinity at hA1, hA2A and hA3 ARs and potencies at hA2B ARs.
Figure 3. Interaction Energy Fingerprints (IEFs) comparison between compound 1 and compound ZM-241385 used as reference. Panels A, B and C report the comparison analysis for hA1, hA2A and hA3 receptor subtypes, respectively. On the left side is shown the electrostatic contribution comparison, while on the right the hydrophobic one. In each subsection, the IEFs of compound 1 are shown above the IEFs of the reference ZM-241385.
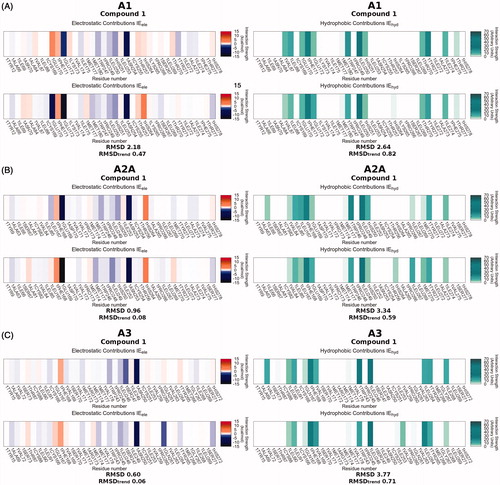
Figure 4. Comparison of the proposed binding mode of compound 1 (sky blue), compound A (pink), and reference pose of ZM-241385 (green) on hA1, hA2A and hA3 subtype receptors (panels A, B and C, respectively). Protein residues mainly involved in binding are shown as sticks (tan). The zoom makes TM1 not visible, while TM6 and TM7 are rendered in a transparent manner to give a more clear visualization of the binding site.
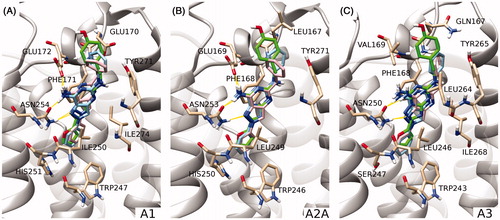
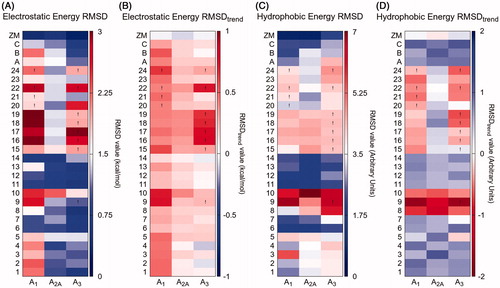
Figure 5. Results of the IEFs comparison between all compounds and reference compound ZM-241385. RMSDs and RMSDtrend between electrostatic (panels A and B, respectively) and hydrophobic (panels C and D, respectively) Energy Fingerprints of each compound (y-axis) and reference ZM-241385 are reported for hA1, hA2A and hA3 receptors (x-axis). A colorimetric scale going from blue to red represents favorable to unfavorable values. An exclamation point identifies those poses that have a positive van der Waals and/or electrostatic potential (and for which was not possible to select an alternative pose with negative values).