Figures & data
Figure 1. Scaffold evolution of MAO B inhibitors: from dihydro-pyrazoles to dihydro-isoxazoles.
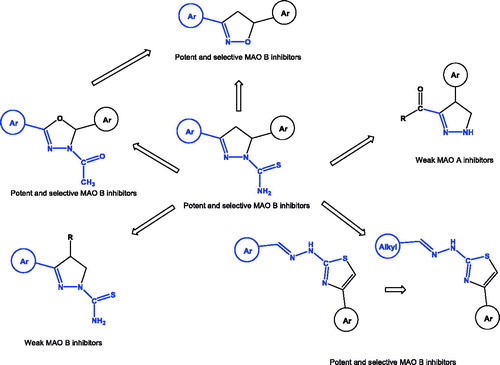
Table 1. Chemical, analytical, and physical data of derivatives EMAC II (i–m).
Table 2. 1H NMR data and main fragments in E.I. mass spectrometry of derivatives EMAC II (i–m).
Scheme 1. Synthesis of EMAC II (i–m) compounds. Reagents and conditions: (i) ethanol, NaOH; (ii) ethanol, hydroxylamine hydrochloride, potassium hydroxide, reflux.
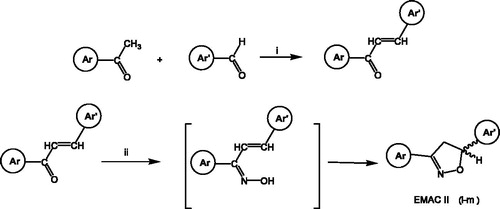
Figure 2. An ORTEP view of the molecular structure of (R)-(−)-EMAC II i enantiomer.
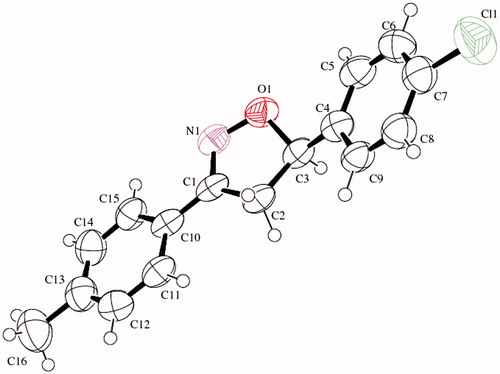
Figure 3. Effect of Fe2+ or Fe3+ ions on the spectrum of absorbance of EMAC II l. UV/vis spectrum was measured with 100 μM of compound alone (unbroken line) or in the presence of 10 mM FeCl3 or FeSO4 (dotted line).
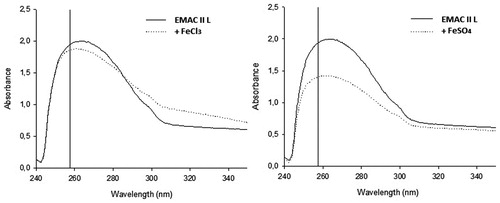
Table 3. Inhibitory activities towards hMAO-A and hMAO-B of EMAC II (i–m) derivatives.
Table 4. Inhibitory activities towards hMAO-A and hMAO-B of EMAC II (i–m) single enantiomers.
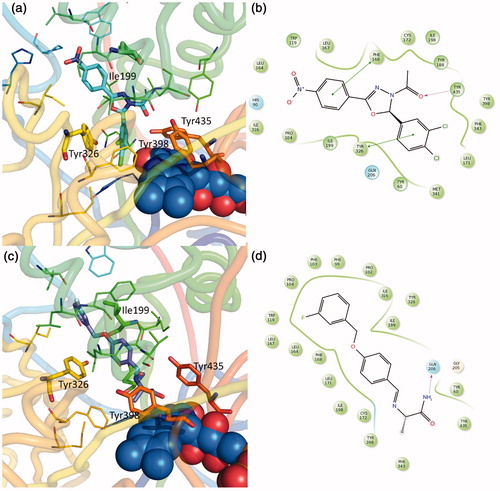
Figure 4. Putative binding mode of compound EMAC II l. (a) R-(−)-EMAC II l/MAO-B complex; (c) S-(+)-EMAC II l/MAO-B complex; (b, d) compound 2D representation and binding pocket interacting residues: green, hydrophobic; cyan, polar residues. Green arrows indicate π−π interactions.
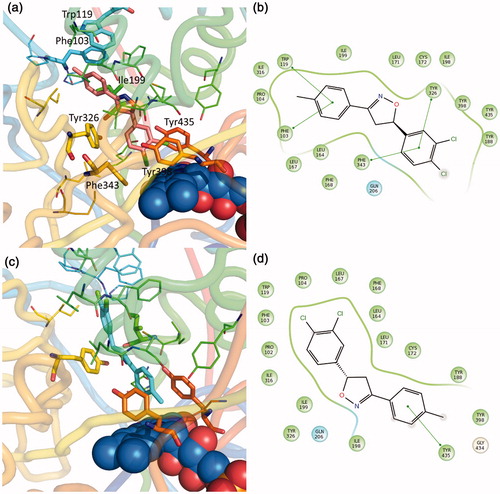
Figure 5. Binding mode of previously published compounds and approved inhibitors. (a) 4f-(R) MAO-B complexCitation21; (c) safinamide MAO-B complex (pdb code 4v5z)Citation25; (b, d) compound 2D representation and binding pocket interacting residues: in green, hydrophobic; cyan, polar residues. Green arrows indicate π−π interactions, magenta arrow indicates H bonds.