Figures & data
Scheme 1. Synthesis of new coumarylthiazole-substituted acetamide derivatives. Reaction conditions: (i) Ethylacetoacetate, piperidin, rt, 30 min; (ii) Br2, CHCl3, 50 °C, 15 min; (iii) Thiourea, EtOH, 80 °C, 2 h; (iv) Chloroacetylchloride, Et3N, THF, 70 °C, 8 h; (v) RNH2, DMF, 60 °C, 12 h.
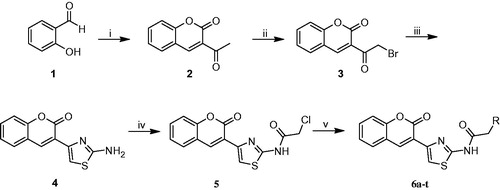
Table 1. In vitro inhibition IC50 values (μM) and selectivity of compounds 6a-t for AChE and BuChE.
Figure 1. Structures of well-known cholinesterase inhibitors and designed compounds.
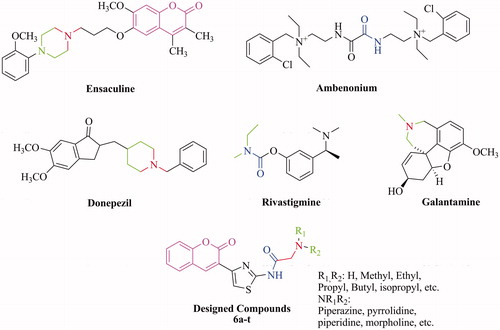
Figure 2. Development strategy and interactions of fragment of the synthesized compounds.
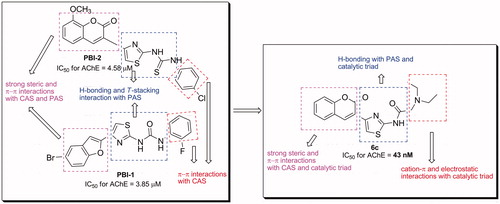
Figure 3. Kinetic study on the mechanism of AChE inhibition by compound 6c. Overlaid Lineweaver–Burk reciprocal plots of AChE initial velocity at increasing substrate concentration (0.05–0.50 mM) in the absence of inhibitor and in the presences of different concentrations of 6c are shown.
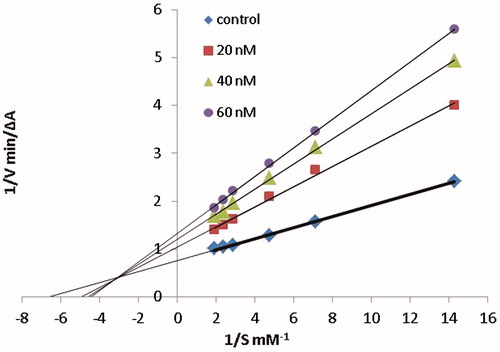
Figure 4. (A) Superposition of crystallographic structures for TcAChE co-crystallized with tacrine (1ACJ, in green) and Donepezil (1EVE, in blue). (B) Superposition of TcAChE (1EVE residue Phe330, Ile287, in blue) and hAChE (4EY7 residue Tyr337, Val294, in brown), both in complex with Donepezil. Red circles highlight the most important ligand-induced conformational changes. Pairwise sequence alignment for T. californica (PDB ID: 1ACJ, 1EVE) and human (PDB ID: 4EY7) AChE is also provided. The catalytic triad is reported in red.
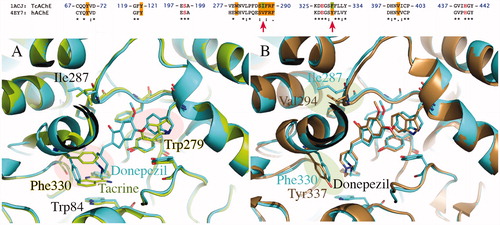
Figure 5. Comparison of TcAChE (1EVE residue Ile287, Phe288, Phe290, Val400, Trp279, Tyr70, Phe330, in blue) and hBuChE (1P0M residue Pro285, Leu286, Val288, Phe398, Ala277, Asn68, Ala328, in gold). The most important changes in aminoacids sequence are highlighted by blue, green and red areas. As shown, modifications generally affect both CAS (1, in blue) and PAS (2, in green and 3, in red).
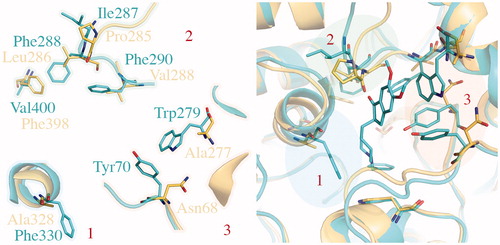
Figure 6. Qualitative representation of correlation between binding energies coming from docking and experimental data. Regarding the TcAChE model, correlation obtained by using 1ACJ/1EVE is reported in blue (R2 = 0.06)/red (R2 = 0.6). Correlation for hBuChE (1P0M) is reported in green.
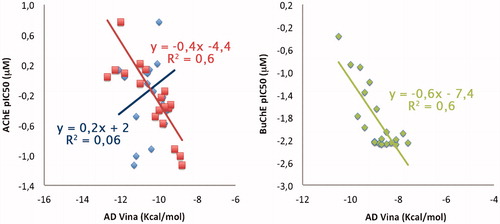
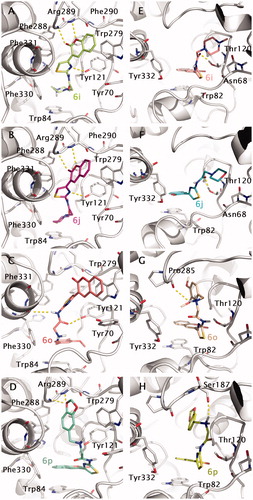
Figure 7. Docking poses for compound 6i, 6j, 6o and 6p into TcAChE (1EVE; A–D) and BuChE (1P0M; E–H) binding sites. Aminoacids relevant for ligand interactions are indicated and reported in white sticks.