Figures & data
Scheme 1. Synthesis of RDS 777. (i) sec-BuOH, Na, reflux, 4 h, 50% Citation12,Citation13; (ii) 3-chlorothiophenol, Pd2(dba)3, DPPF, DIPEA, DMF, reflux, 6.5 h, 68.33%.
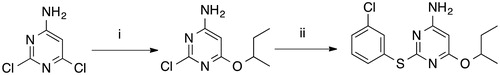
Table 1. Crystal parameters, data collection statistics and refinement statistics of RDS777–TR complex
Figure 1. % Inhibition calculated on L. infantum promastigote stage after treatment with various concentrations of RDS777 and reference drug Amphothericin B (AmB). The data are expressed as mean ± standard error of two independent experiments.
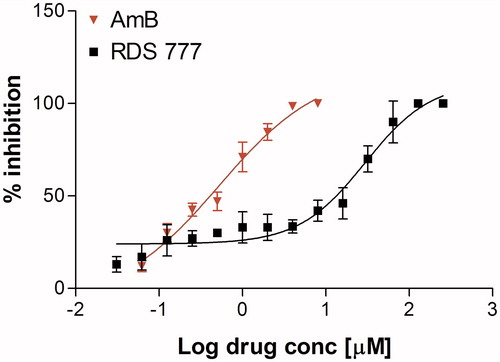
Figure 2. Dixon plot of TR inhibition by RDS777: open circles [TS2] = 75 μM; filled squares [TS2] = 100 μM; filled diamonds [TS2] = 200 μM and open squares [TS2] = 400 μM.
![Figure 2. Dixon plot of TR inhibition by RDS777: open circles [TS2] = 75 μM; filled squares [TS2] = 100 μM; filled diamonds [TS2] = 200 μM and open squares [TS2] = 400 μM.](/cms/asset/e9503876-ca64-44eb-8813-6242271d15c3/ienz_a_1250755_f0002_b.jpg)
Figure 3. Overall fold of TR in complex with RDS 777. RDS777 is represented as CPK and colored orange and the FAD molecules is represented as sticks and colored in yellow. The seven RDS777 molecules bound to the TR protein are indicated with the a–d letters.
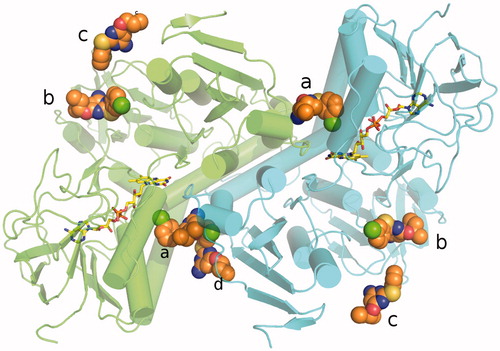
Figure 4. Electronic density map of the RDS777–TR complex active site. (A) 2Fo-Fc map of the monomer A. (B) 2Fo-Fc map of the monomer B. RDS 777 and the residues interacting with the compounds are represented as sticks. The 2Fo-Fc map is colored blue and contoured at 1 σ.
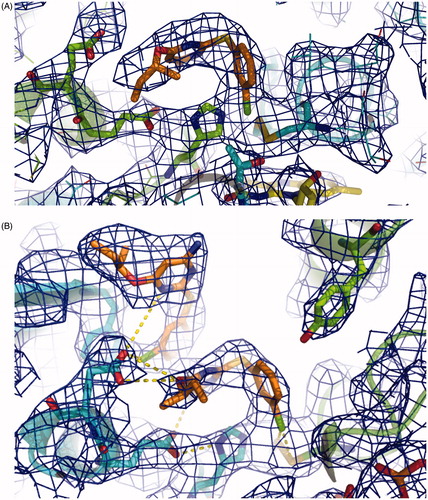
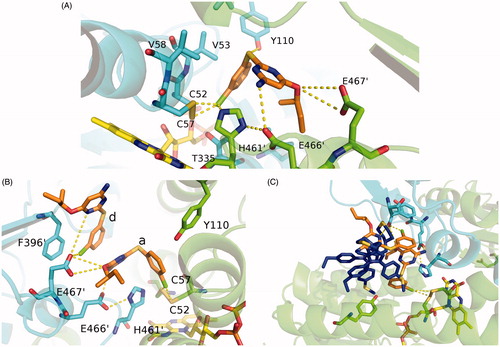
Figure 5. Blow up of the active site of TR. (A) Interaction map of RDS 777 in the TR-active site of monomer A. The residues interacting with RDS 777 are indicated and represented as sticks. (B) Interaction map of the a and d RDS777 molecules in the TR-active site of monomer B. The residues interacting with RDS 777 are indicated and represented as sticks. (C) Superimposition between the compound1–TR structure (PDB code 4APN) and RDS777–TR structure. The two molecules of compound 1 (4-((1–(4-ethylphenyl)-2-methyl-5–(4-(methylthio) phenyl)-1H-pyrrol-3 yl)methyl)thiomorpholine), RDS 777 and FAD are represented as sticks.