Figures & data
Scheme 1. Flowchart of the current study in the effort for identifying novel and selective PDE5 inhibitors.
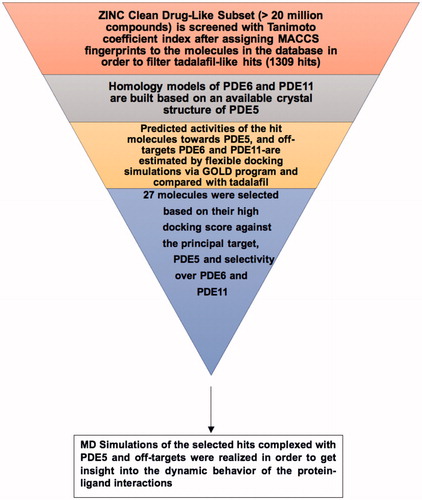
Figure 1. Electrostatic maps of the active sites of the enzymes (left panel). Blue, red and white colours represent positively charged, negatively charged and hydrophobic preferences built at the drug-binding cavity site (near 5 Å distance from the ligand). Tadalafil fulfils the positively charged electrostatic requirement created by the acceptor atom (Oɛ) of the invariant Glutamine side chain in each active sites via carrying a hydrogen-bond donating moiety (–NH) at the amide fragment (namely, Glutamine Switch). On the other hand, hydrophobic residues, Phe820, Phe776 and Trp 820, sandwich the ligand (namely, Hydrophobic Clamp). 2D ligand–protein interaction diagrams (right panel). Green arrows indicate hydrogen bonding interactions. Green and purple discs show hydrophobic and polar residues, respectively. Representations are created with MOE molecular modeling package.
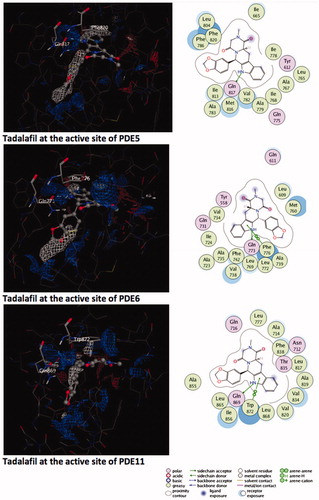
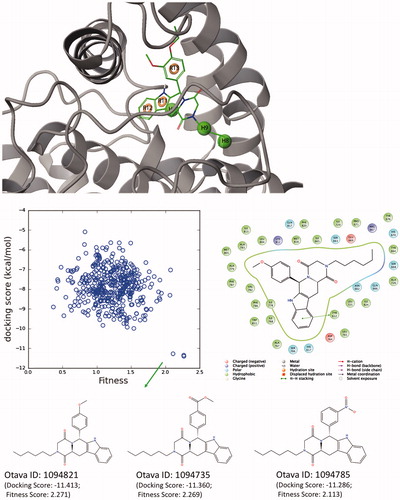
Figure 2. Top docking poses of tadalafil with PDE enzymes. Only polar hydrogens are shown for clarity. Protein residues within 2.5 Å distance around tadalafil are depicted in the figures. Hydrogen bonds between amide hydrogen of tadalafil and Oɛ atom of invariant Glutamine amino acid residue are represented with red dashed lines.
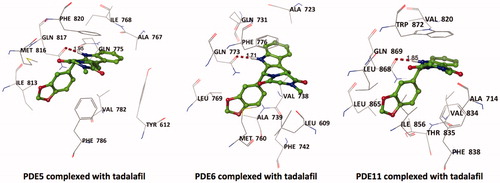
Figure 3. Superposition of PDE5, PDE6 and PDE11, illustrated with blue, cyan and red colors, respectively. The counterions, Zn2+ and Mg2+, are shown with blue circles at the metal binding side.
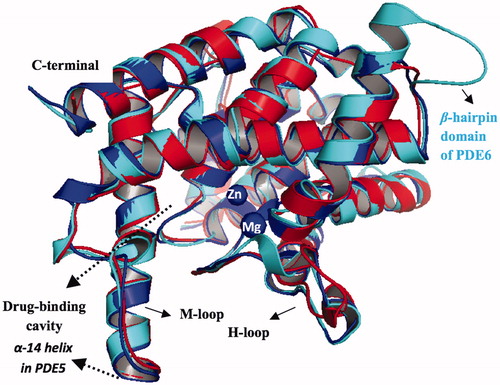
Figure 4. Superposition of 27 selected compounds at the end of the docking simulations.
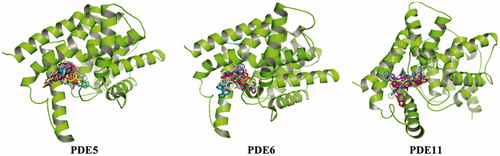
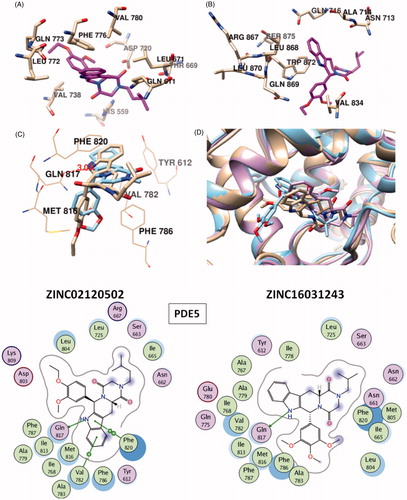
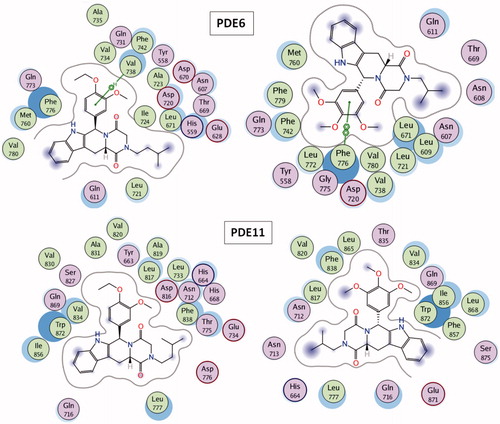
Table 1. Predicted binding free energies (Chemscore.dG) and 2D structures of ZINC compounds against the principal target, PDE5 and off-target enzymes, PDE6 and PDE11 (binding scores are expressed in kJ/mol and calculated by Chemscore fitness function implemented in GOLD Docking Program). Chemscore.dG values were converted to IC50 values – for the purpose of selectivity comparison – according to the formula; ΔGbinding= RTlnIC50, where T is taken as 300 K.
Figure 6. Traces of protein backbone RMSD (root-mean-squared-deviation) evaluation during the whole production stages of the MD Simulations.
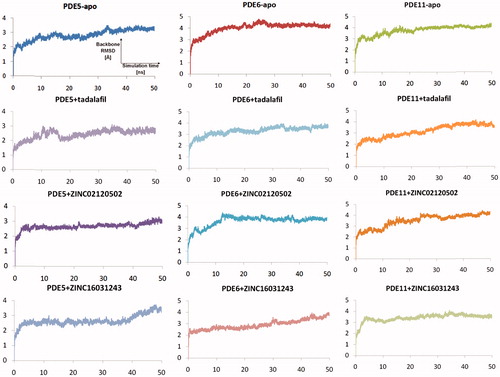
Figure 7. The RMSD evaluation of the ligands during the simulation time.
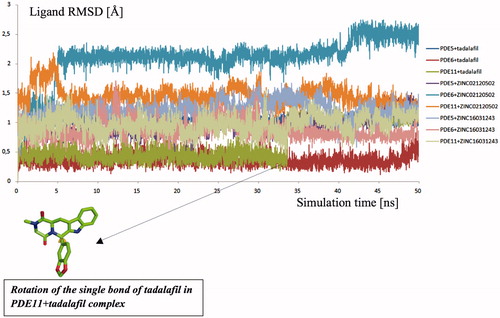
Figure 8. Traces of hydrogen bonding interactions throughout simulation time (x and y axis represents the simulation time and distances between O? atoms of Gln817 (PDE5), Gln773 (PDE6), Gln869 (PDE11) and indole fragments hydrogen in the ligands, respectively). Color codes: orange: PDE5 + ZINC16031243; purple: PDE11 + tadalafil; blue: PDE5 + ZINC02120502; red: PDE5 + tadalafil; green: PDE6 + tadalafil.
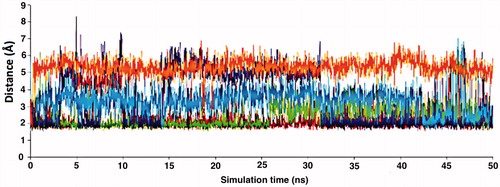
Figure 9. Simulated structures of ZINC0210502 and ZINC16031243 at the substrate pockets of PDE5, PDE6 and PDE11.
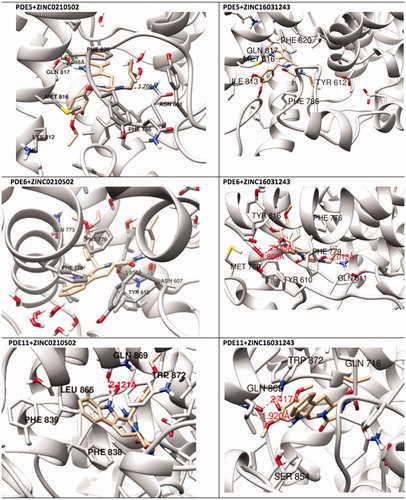
Figure 10. Overlay of docking pose (blue) and representative structure of ZINC02120502 (white) in the catalytic pocket of PDE11.
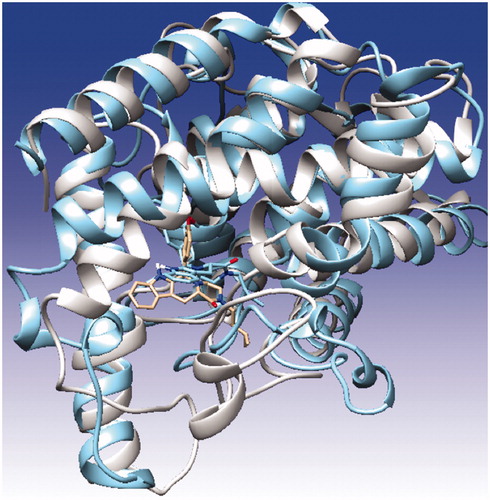
Figure 11. Root-mean-square fluctuation (RMSF) values per residue during the MD simulations.
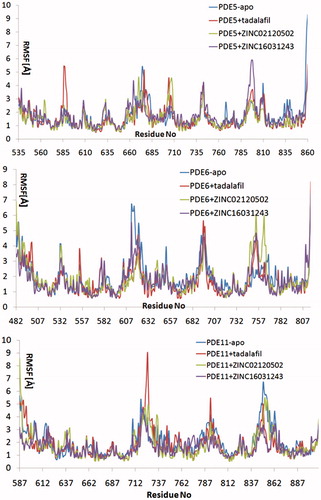
Table 2. Comparison of protein–ligand free energy results of tadalafil with selected hit compounds using MM/GBSA calculations.
Table 3. Predicted binding affinities of the selected compounds within the hERG K+ channel. Each compound was docked into the central cavities of the channel by GOLD docking software with Chemscore fitness function. Dockings were realized by considering the two known conformational states of the channel. OS and OIS states stand for the open and open-inactivated states. dG.Chemscore values are expressed in kJ/mol. Tadalafil and the two selected potent and selective PDE5 inhibitor compounds, ZINC02120502 and ZINC16031243 are shown in bold in the table.
Figure 12. (Top) Derived top-scored six-sited (RRRHHH) E-pharmacophore model; (bottom) 176 000 compounds from Otava small-molecules database are screened against derived pharmacophore model and top-1000 compounds that have high Fitness scores with these sites are then docked at the PDE5 binding pocket using Glide/SP (standard precision). Compounds that show high docking scores as well as high fitness scores are shown in the figure. 2D ligand interaction diagram of selected Otava compound (1094821) is also represented in the figure.