Figures & data
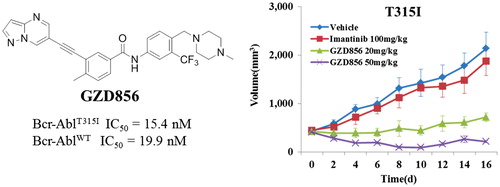
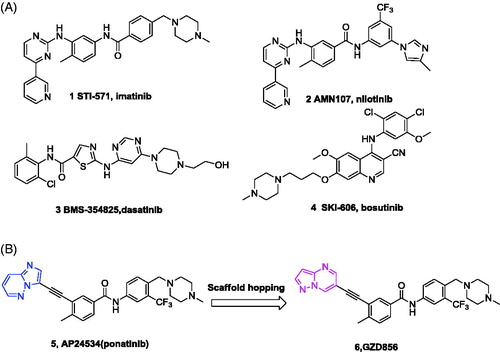
Figure 1. (A) Chemical structures of FDA-approved Bcr-Abl inhibitors; (B) design of GZD856 as new Bcr-Abl inhibitor by scaffold hopping based on ponatinib.
Scheme 1. Synthetic route of compound GZD856. Reagents and conditions: (a) i. Pd(dppf)2Cl2, CuI, Et3N, DMF, 80 °C; ii. K2CO3, MeOH, rt, 90%; (b) Pd(PPh3) Cl2, CuI, DIPEA, DMF, 80%; (c) t-BuOK, THF, −20 °C, 75%.
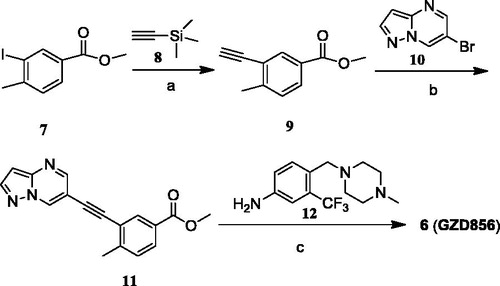
Table 1. Inhibitory activities of GZD856 against Bcr-AblWT and Bcr-AblT315I mutant.
Figure 2. The predicted binding mode of GZD856 with Bcr-AblT315I. Hydrogen bonds are indicated by yellow hatched lines to key amino acids.
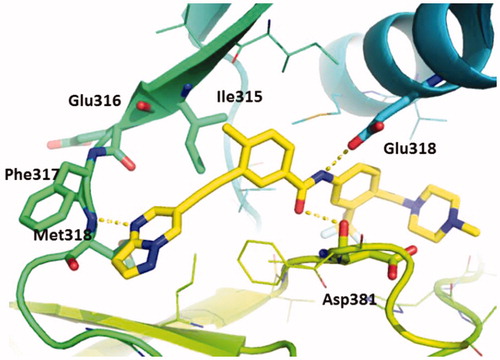
Table 2. GZD856 selectively and potently inhibited the proliferation of Bcr-Abl positive leukemia cells.
Figure 3. GZD856 inhibits Bcr-Abl signaling in K562 and Ba/F3 stable cell lines expressing Bcr-AblWT and Bcr-AblT315I. Cells were treated with GZD856 at the indicated concentrations for 4.0 h, and whole cell lysates were then subjected to Western blot analyses. The results represent three independent experiments.
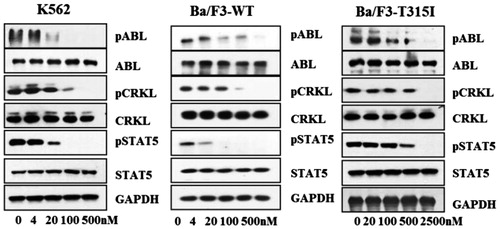
Figure 4. GZD856 potently suppressed tumor growth in K562 xenograft model of human CML. Mice bearing K562 xenografts were dosed orally once a day with GZD856 at 10 mg/kg dosages for 16 consecutive days. The data are representative of three independent experiments.
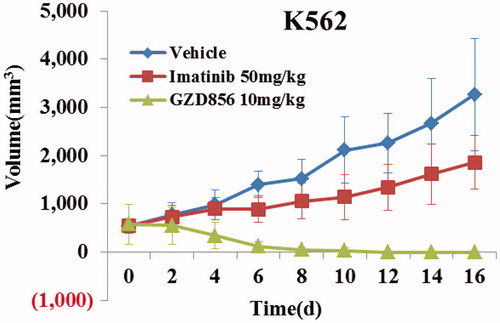
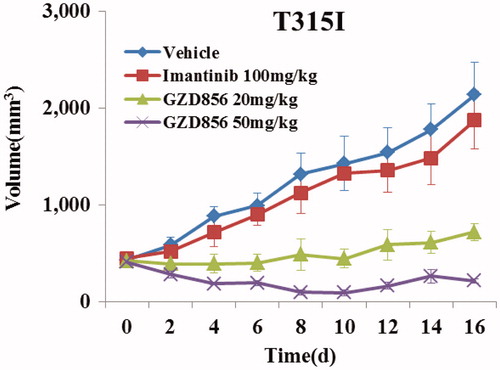
Figure 5. GZD856 suppressed tumor growth in xenograft models of Ba/F3 cells expressing Bcr-AblT315I. Mice bearing xenograft Ba/F3 Bcr-AblT315I cells were orally dosed with GZD856 and imatinib at the indicated doses. Tumor sizes were monitored every 2 days (n = 10 for each group; error bar represents SE).