Figures & data
Figure 1. XO ligand structures, atom, and fragment naming. (a) The structures of fraxamoside (Compound 1), oleuropein (Compound 2), oleoside 11-methyl ester (Compound 3), and hydroxytyrosol (Compound 4) are shown along with the atom naming scheme (reported for 2). (b) Representation of the different fragments discussed in the paper, highlighted for 2 by a dark gray area (hty) with a medium gray enclosure surrounded by a dotted line (cathecol), a light gray area (βgl), and a thick black contour line (sir).
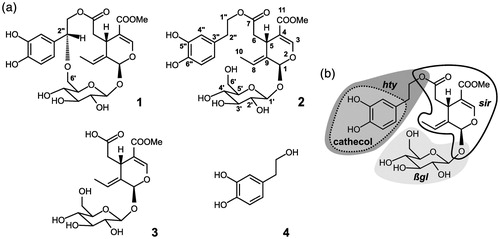
Table 1. Inhibitory effect of selected compounds on XO.
Figure 2. XO Inhibition. (a) Inhibition of XO by fraxamoside. About 0.03 U of XO was incubated in a 500 μL buffer A supplemented with xanthine ranging from 0 to 10 μM final concentration, in the absence (black line) or in the presence of fraxamoside concentrations of 0.19 (red line), 0.83 (blue line), 1.9 μM (green line), following kinetically the formation of uric acid. The reaction rate v was expressed as ΔE/sec, where ΔE is the difference of absorbance measured at 295 nm. Inset Figure a: the data from the Lineweaver–Burk plots were treated according to the equation described in “Methods”. (b) Inhibition of XO by allopurinol. The same as in A except that allopurinol was tested as inhibitor at 0.62 (red line), 1.6 (blue line), and 2.8 μM (green line) final concentrations. Inset Figure b: the data from the Lineweaver–Burk plots were treated according to the equation described in “Methods”.
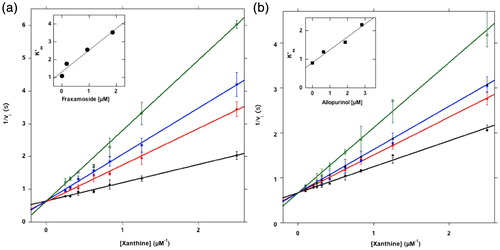
Figure 3. Ligand RMSD plots for MD simulations of selected docking models of XO complexes with Compounds 1–3. The positional RMS deviations for ligand atoms during the 10 ns MD refinement runs, calculated after best fit of the protein backbone atoms, are shown for the 1 (a), 2 (b), and 3 (c) XO-complex models selected after docking.
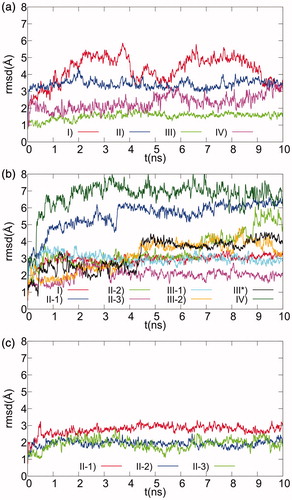
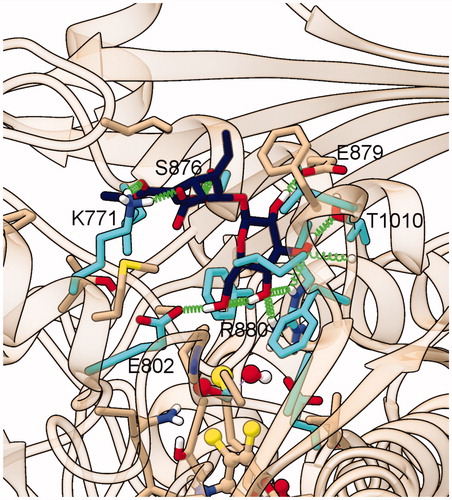
Figure 4. Representative structure of the ligand binding site of the final model of the XO complex with fraxamoside (Compound 1). The site of the representative frame from the last 5 ns of MD for the XO-fraxamoside complex III model is shown adopting a partially transparent tan ribbon representation for protein backbone, and sticks for ligand, prosthetic groups, and protein sidechains of residues involved in contacts with either ligands or dioxothiomolybdenum(VI) ions. Atoms are colored with the following scheme: O = red, N = blue, H = white, S = yellow, P = orange, Mo = light-blue, cyan = C atoms from residues involved in conserved interactions with all structurally characterized XO ligands, solid tan = C atoms from residues exhibiting specific interactions with fraxamoside and magenta = C atoms in fraxamoside. Ligand-protein H-bonds are depicted with a green spring.
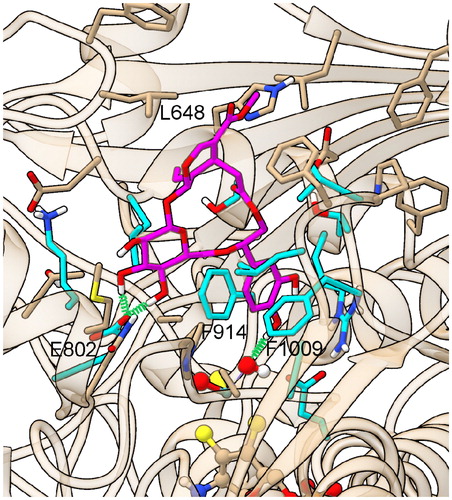
Figure 5. XO-ligand contacts in PDB structures and in models of complexes with Compounds 1–3. The first column reports XO residues contacting ligand in PDB structures of XO complexes and in XO-Compound 1/2/3 models. Asterisk (*), degree (°), and caret (^) symbols mark those residues exhibiting interactions with all, all minus oxypurinol, and all minus quercetin PDB ligands, respectively, while parentheses enclose residues exhibiting close contacts with Compound 1 and/or 2 and/or 3 alone. Other columns shows protein-ligand contacts in PDB structures of XO complexes and in MD trajectories of XO-Compound 1/2/3 models, with the following color scheme green = covalent bond; cyan = H-bond; yellow = vdW contacts within 4 Å; light-yellow = vdW contacts between 4 Å and 5 Å; orange = involved into π-stacking, brown = perpendicular π–π interaction. Yellow stripes on a cyan field indicate fluctuating H-bond interactions observed in >1/3 of the MD frames. The following abbreviations are used for ligands and nonstandard residues: MOS = dioxothiomolybdenum(VI) ion, OXP = oxypurinol, FBX = febuxostat, FYX = FYX-051, O3FYX = trihydroxy-FYX-051, Y700 = Y-700, QUE = quercetin. Ligand atoms/groups responsible for close interaction in Compound 1/2/3 complexes (for names and numbering see ) are listed in the corresponding cells. “x” and “CO” superscripts indicate both O and only the carbonylic O atom in COO groups, respectively. Multiple atoms/groups are separated by a slash (/) symbol.
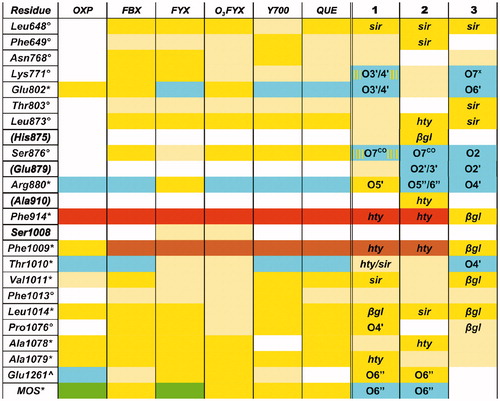
Figure 6. Representative structures of the ligand binding site of the final models of the XO complexes with oleuropein (Compound 2). The sites of the representative frames from the last 5 ns of MD for the XO-oleuropein complexes I (a) and II-3 (b) are shown with the same representation and colors used in , except for C atoms of oleuropein, in orange.
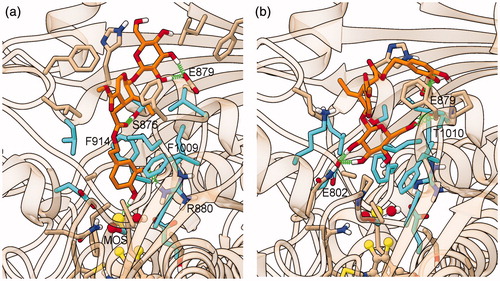
Figure 7. Representative structure of the ligand binding site of the final model of the XO complex with oleoside 11-methyl ester (Compound 3). The site of the representative frame from the last 5 ns of MD for the XO-Compound 3 complex II-2 is shown with the same representation and colors used in , except for C atoms of Compound 3, in dark blue.