Figures & data
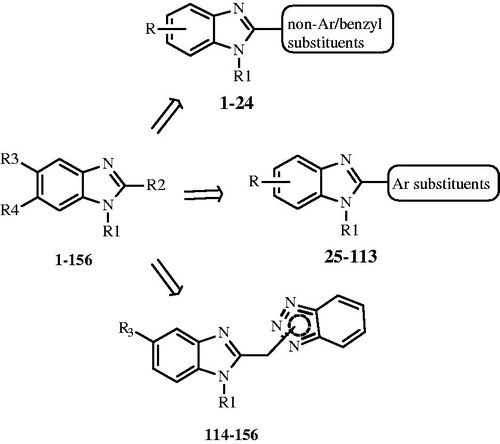
Figure 1. General structures of benzimidazole-based anti-RSV agents
Scheme 1. Reagents and conditions: (a) 120 °C, 9 h; (b) SnCl2 . 2H2O, conc. HCl, EtOH, 6 h at reflux; (c) 180°, N2, 90 min.
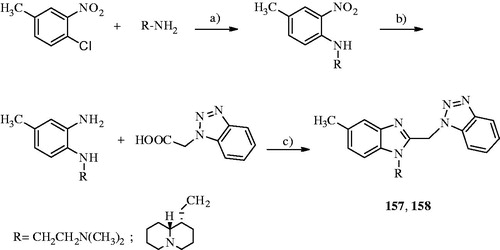
Table 1. Chemical structure of benzimidazoles 1–156Table Footnote* and the related anti-RSV potency and cytotoxicity profiles (evaluated against MT-4 and VERO-76 cell lines)
Table 2. Summary of CoMFA and CoMSIA analyses calculated as model A and B.
Table 3. Model A CoMFA and CoMSIA analyses experimental and predicted pEC50 values of the training set compounds.
Table 4. Model A CoMFA and CoMSIA analyses experimental and predicted pEC50 values of the test set compounds.
Table 5. Model B CoMFA and CoMSIA analyses experimental and predicted pCC50 values of the training set compounds.
Table 6. Model B CoMFA and CoMSIA analyses experimental and predicted pCC50 values of the test set compounds.
Figure 2. Contour map of model A CoMFA steric regions are shown around the anti-RSV agent 44 (a) and 11 (b). The compounds are displayed in ball and stick mode.
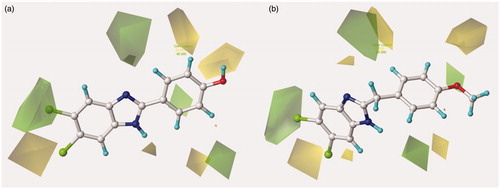
Figure 3. Contour map of model A CoMFA steric regions are shown around the anti-RSV agent 126 (a) and 148 (b). The compounds are displayed in ball and stick mode.
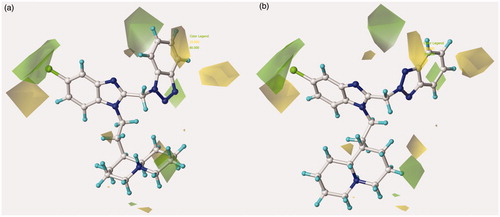
Figure 4. Contour maps of model A CoMFA electrostatic regions are shown around the anti-RSV agents 44 (a) and 11 (b). The compounds are displayed in ball and stick mode.
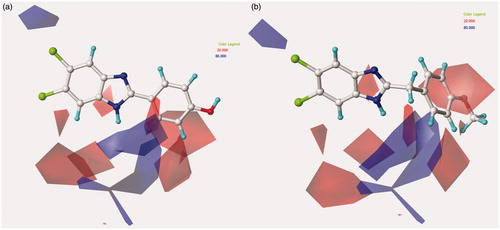
Figure 5. Contour maps of model A CoMFA electrostatic regions are shown around the anti-RSV agents 126 (a) and 148 (b). The compounds are displayed in ball and stick mode.
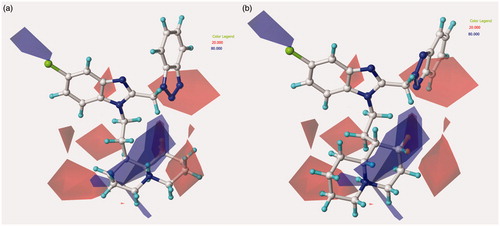
Figure 6. Model A CoMSIA hydrophobic favoured and disfavoured regions are shown around the anti-RSV agents 126 (a) and 148 (b). The compounds are displayed in ball and stick mode.
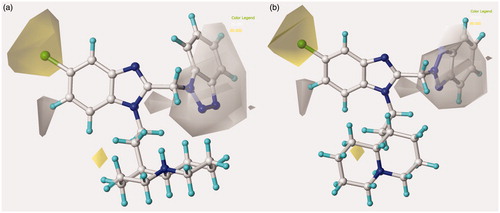
Figure 7. Model A CoMSIA H-bond acceptor favoured and disfavoured contour maps are displayed around benzimidazoles 126 (a) and 148 (b). The compounds are displayed in ball and stick mode.
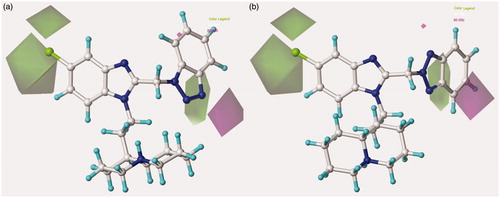
Figure 8. Model A CoMSIA H-bond donor favoured and disfavoured contour maps are shown around the anti-RSV agents 126 (a) and 148 (b). The compounds are displayed in ball and stick mode.
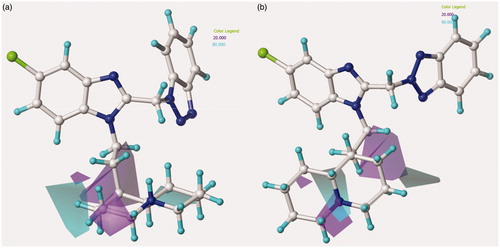
Figure 9. Contour map of model B CoMFA steric regions are shown around the anti-RSV agent 95 (a) and 156 (b). The compounds are displayed in ball and stick mode.
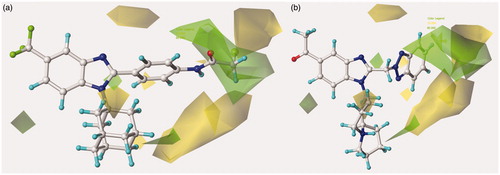
Figure 10. Contour maps of model B CoMFA electrostatic regions are shown around the anti-RSV agents 95 (a) and 156 (b), represented in stick mode.
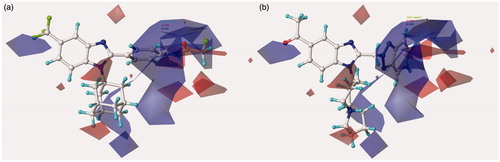
Figure 11. Model B CoMSIA hydrophobic favoured and disfavoured regions are shown around the anti-RSV agents 95 (a) and 156 (b), represented in stick mode.
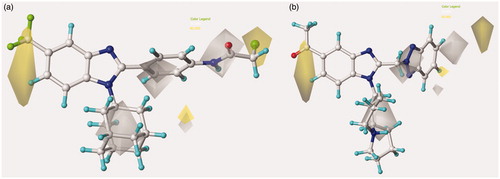
Figure 12. Model B CoMSIA H-bond acceptor favoured and disfavoured contour maps are displayed around benzimidazoles 95 (a) and 156 (b), depicted in stick mode.
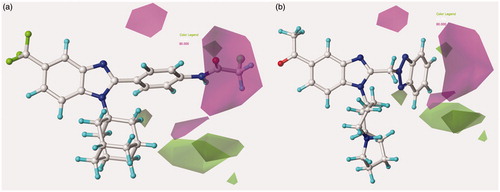
Figure 13. Model B CoMSIA H-bond donor favoured and disfavoured contour maps are shown around the anti-RSV agents 95 (a) and 156 (b), represented in stick mode.
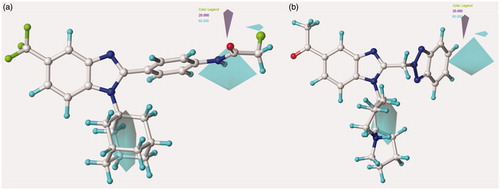
Figure 14. Chemical structure of the anti-RSV agent BMS-433771.
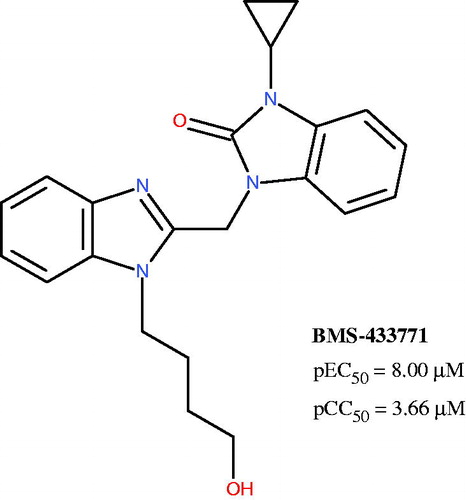
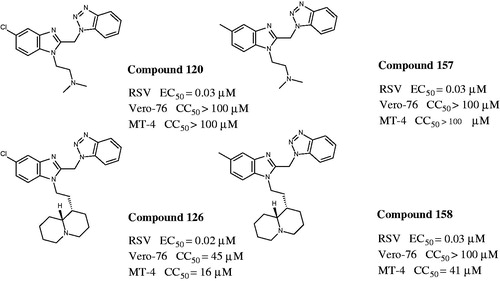
Figure 15. Chemical structures and biological data about the prototypes 120, 126 and the 5-methyl newly synthesised analogues 157, 158.