
Figures & data
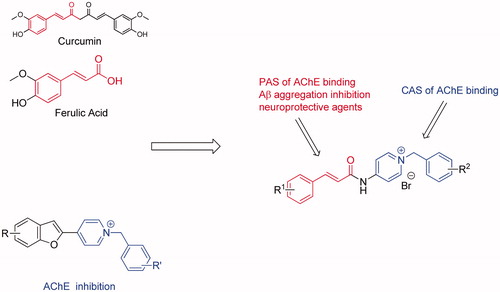
Figure 1. Drug design strategy for multi-target-directed ligands.
Scheme 1. Synthesis of cinnamic acid derivatives 5a–n. Reagents and conditions: (i) DMAP/EDCI, CH2Cl2, rt., 12 h; (ii) CH3CN, reflux, 1–3 h.
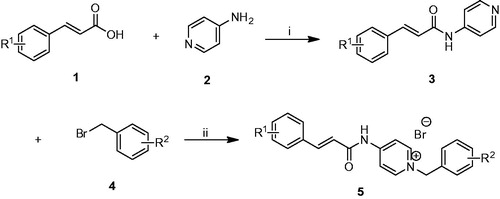
Table 1. Inhibition of ChEs activity and selectivity index of compounds 5a–n.
Table 2. Inhibition of ChEs activity and selectivity index of compounds 5i–n.
Figure 2. Kinetic study on the mechanism of EeAChE inhibition by compound 5l. Overlaid Lineweaver–Burk reciprocal plots of AChE initial velocity at increasing substrate concentration (0.05–0.50 mM) in the absence of inhibitor and in the presence of compound 5l are shown. Lines were derived from a weighted least-squares analysis of the data points.
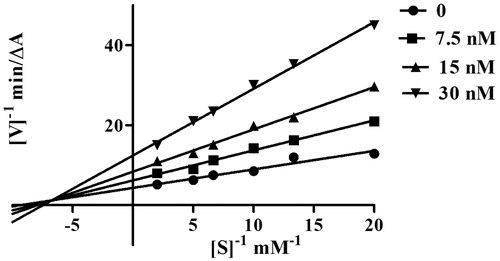
Figure 3. (A) 3D docking model of compound 5l with TcAChE. Atom colors: yellow – carbon atoms of 5l, gray – carbon atoms of residues of TcAChE, dark blue – nitrogen atoms, red – oxygen atoms. The dashed lines represent the interactions between the protein and the ligand. (B) 2D schematic diagram of docking model of compound 5l with TcAChE. The figure was prepared using the ligand interactions application in MOE.
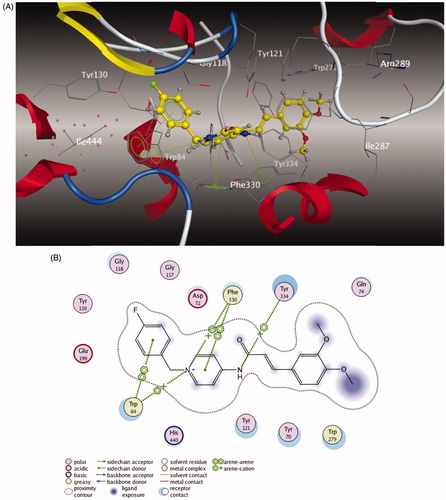
Figure 4. (A) UV absorbance spectrum of 5l (50 μM) alone (red) or in the presence of 100 μM CuSO4 (green) and 100 μM FeSO4 (yellow) in MeOH. (B) Determination of the stoichiometry of complex 5l−Cu2+ by molar ratio method.
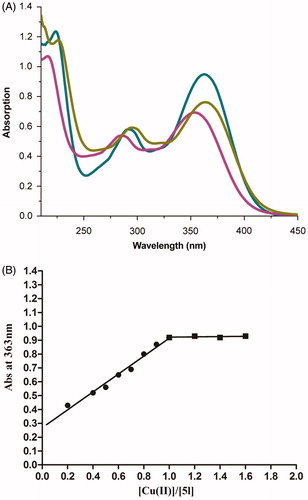
Table 3. Inhibition of Aβ (1–42) self-induced aggregation and ABTS radical by target compounds.
Figure 5. Inhibition of Cu2+-induced Aβ (1–42) aggregation by compound 5l comparing with that of clioquinol (CQ) ([Aβ = 25 μM, [5l] = 50 μM, [CQ] = 50 μM, [Cu2+] = 25 μM, 37 °C, 24 h). Values are reported as the mean ± SD of three independent experiments. #p < .05, **p < .01.
![Figure 5. Inhibition of Cu2+-induced Aβ (1–42) aggregation by compound 5l comparing with that of clioquinol (CQ) ([Aβ = 25 μM, [5l] = 50 μM, [CQ] = 50 μM, [Cu2+] = 25 μM, 37 °C, 24 h). Values are reported as the mean ± SD of three independent experiments. #p < .05, **p < .01.](/cms/asset/0c808715-5902-4a59-ac71-38a45ca9cf50/ienz_a_1256883_f0005_b.jpg)
Figure 6. Docking study of compound 5l with Aβ (1–42) generated with MOE. Atom colors: yellow – carbon atoms of 5l, gray – carbon atoms of residues of Aβ (1–42), dark blue – nitrogen atoms, red – oxygen atoms. The dashed lines represent the interactions between the protein and the ligand.
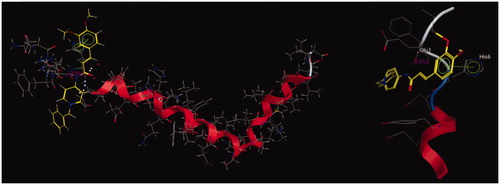
Figure 7. (A) Effects of compound 5l on cell viability in PC12 cells. The cell viability was determined by the MTT assay after 24 h of incubation with various concentrations. The results were expressed as a percentage of control cells. Values are reported as the mean ± SD of three independent experiments. (B) Neuroprotection against Aβ (1–42) toxicity. Compound 5l was tested for neuroprotective activity against Aβ (1–42) toxicity in PC12 cells. Data represent the mean SD of three observations. *p < .05 and **p < .01 compared to the Aβ (1–42)-treated control group.
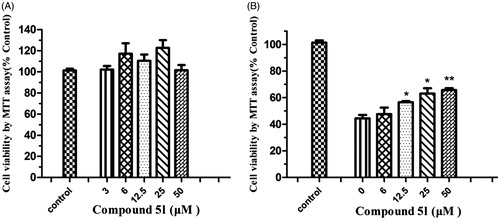
Table 4. Permeability (Pe×10−6 cm s−1) in the PAMPA-BBB assay for nine commercial drugs, used in the experiment validation.