
Figures & data
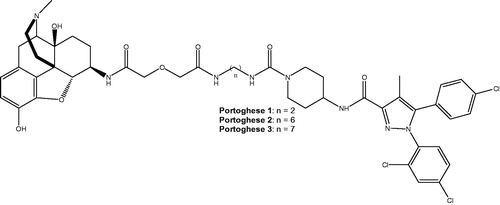
Figure 1. Structure of bivalent compounds previously designed by Le Naour et al.Citation6
Scheme 1. Synthesized Rimonabant analogs.
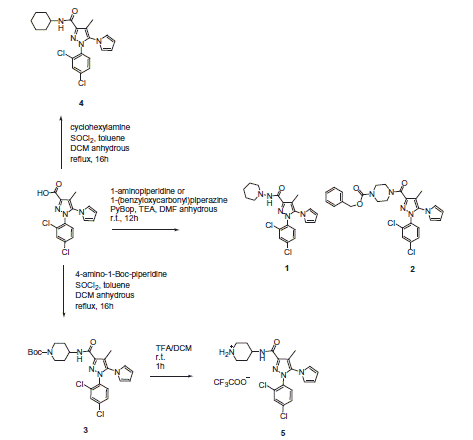
Figure 2. The binding affinity of Rimonabant and its analogs on CBR (A) and the MOR (B), DOR (C), KOR (D) and CBR binding affinity of 5, 9 and 10 (Tyr-D-Ala-Gly-Phe-NH2) (E) in competition binding experiments. Figures represent the specific binding of [3H]WIN55 212–2, [3H]DAMGO, [3H]IleDelt II and [3H]HS665 in percentage in the presence of increasing concentrations (10 −11–10−5 M) of the indicated unlabeled ligands performed in rat (A, B and E) or in guinea pig (D) whole brain membrane homogenates. “Total” on the x-axis indicates the total specific binding of radioligand, which is measured in the absence of the unlabeled compounds. The level of total specific binding was defined as 100% and is presented with a dotted line. Points represent means ± SEM for at least three experiments performed in duplicates.
![Figure 2. The binding affinity of Rimonabant and its analogs on CBR (A) and the MOR (B), DOR (C), KOR (D) and CBR binding affinity of 5, 9 and 10 (Tyr-D-Ala-Gly-Phe-NH2) (E) in competition binding experiments. Figures represent the specific binding of [3H]WIN55 212–2, [3H]DAMGO, [3H]IleDelt II and [3H]HS665 in percentage in the presence of increasing concentrations (10 −11–10−5 M) of the indicated unlabeled ligands performed in rat (A, B and E) or in guinea pig (D) whole brain membrane homogenates. “Total” on the x-axis indicates the total specific binding of radioligand, which is measured in the absence of the unlabeled compounds. The level of total specific binding was defined as 100% and is presented with a dotted line. Points represent means ± SEM for at least three experiments performed in duplicates.](/cms/asset/57f77533-6400-47fa-a575-7c7aac083a8c/ienz_a_1260565_f0002_b.jpg)
Table 1. The maximal G-protein efficacy (Emax) and ligand potency (logEC50) of the Rimonabant and its analogs 1, 2, 3, 4, 5, bivalent compound 9 and opioid peptide 10 in [35S]GTPγS binding assays on rat brain membrane homogenates. The values were calculated according to dose–response curves in Figure S1 (see SI) as described in the “Data analysis” section.
Scheme 2. Synthesis of bivalent compound 9.
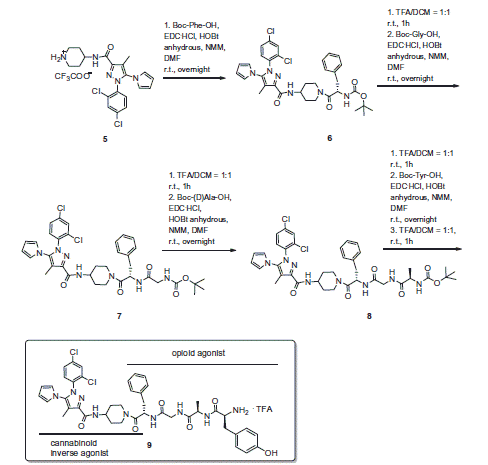
Figure 3. Hot-plate and Tail flick test. In these experiments, compound 9 (C9) was administered i.c.v. at doses of 1, 5 and 10 μg/mouse. V is for vehicle. N = 10.
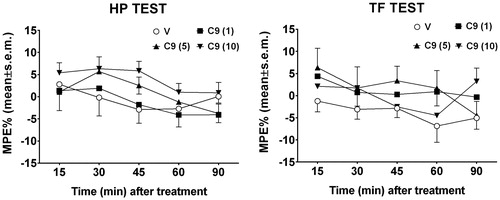
Figure 4. Effect of opioid peptide 10, bivalent compound 9 and 5 on NE and DA release from hypothalamic synaptosomes, in vitro. ANOVA p < 0.0001, ***p < 0.001, **p < 0.01 vs. vehicle.
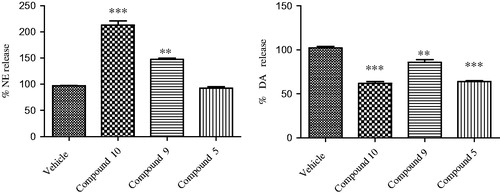
Figure 5. Effect of opioid peptide 10, bivalent compound 9 and 5 on 5-HT release from hypothalamic synaptosomes, in vitro. ANOVA p < 0.05, *p < 0.05 vs. vehicle.
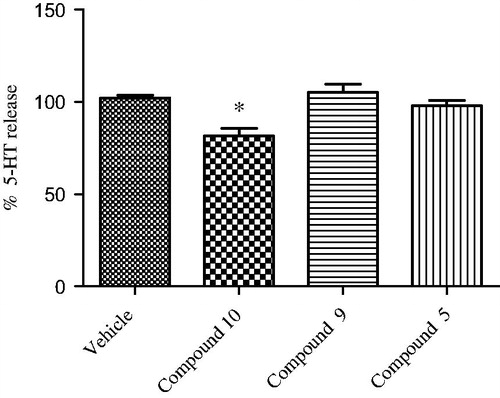
Table 2. AdmetSAR regression derived data for diverse chemicals associated with known ADMET profiles for compounds 5, 9 and 10.