
Figures & data
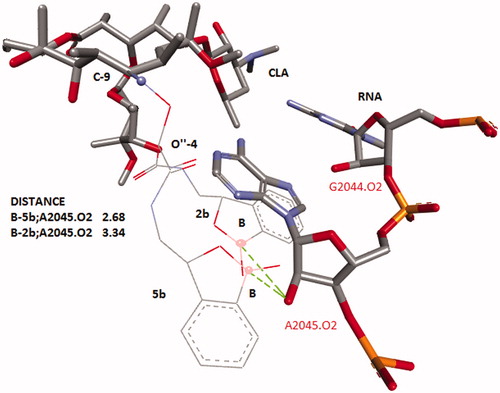
Figure 1. Alignment of conformers of CLA with the benzoxoboroles substituent at C-9 and 4″-O. Structure of CLA’s core was taken from 1J5A.pdb. Benzoxoborole tails were optimized in RNA’s environmental and the structure of RNA was omitted. Distances (in angstroms) are shown as dashed lines.
Scheme 1. Synthesis of clarithromycin derivatives 1–5.
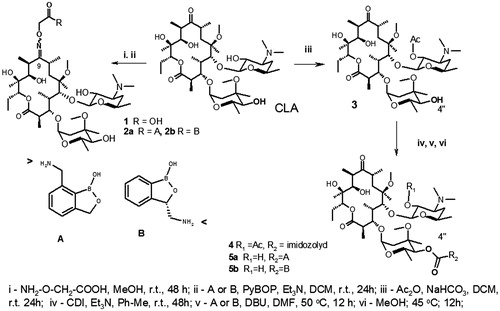
Table 1. MIC’s (μg/mL) of the compounds against test-strains of Gr + and Gr − microbesTable Footnotea.
Table 2. MICs (mg/mL) E. coli K12 WT and tolC strains of E. coliTable Footnotea.