Figures & data
Figure 1. Chemical structures of isolated compounds from Broussonetia papyrifera.
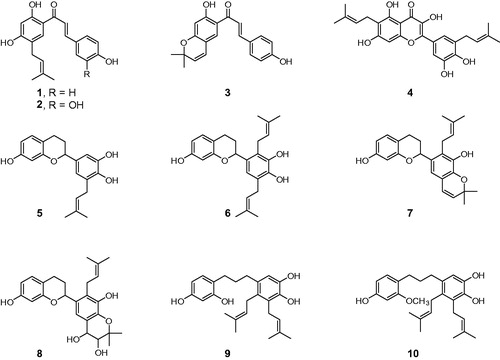
Figure 2. SDS-PAGE of purified MERS-CoV 3CLpro (A) and MERS-CoV PLpro (C); Lineweaver–Burk plots for the determination of Km values against the MERS-CoV 3CLpro (B) and MERS-CoV PLpro (D). (A, C) M, protein molecular-weight markers (kDa); CL, cell lysate; FT, flow-through; W1, 20 mM imidazole wash; E1, E2 and E3, 50, 100 and 200 mM imidazole elution. (B, D) The reaction was done at various substrate concentrations to obtain Km value of the enzyme. SigmaPlot was used to fit the kinetic data using Lineweaver–Burk double reciprocal plots.
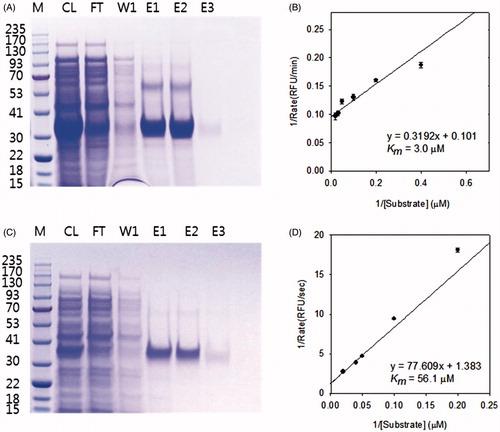
Figure 3. Effects of compounds 1–10 on the activity of SARS-CoV PLpro for proteolysis of substrates (A; LXGG-AMC, B; Ubiqutin-AMC, C; ISG15-AMC).
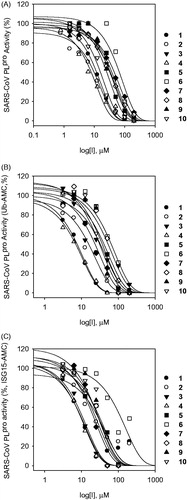
Table 1. Inhibitory effects of isolated polyphenolsCitation1–10 and commercial polyphenols on SARS-CoV cysteine proteases.
Table 2. MERS CoV proteases (3CLpro and PLpro) inhibitory activity of polyphenolsCitation1–10 and commercial polyphenols
Figure 4. Graphical determination of the inhibition type for compounds. (A) Lineweaver–Burk plot for the inhibition of compound 2 on SARS-CoV PLpro. (B) Lineweaver–Burk plot for the inhibition of compound 4 on SARS-CoV PLpro.
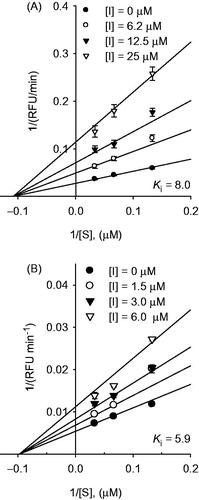
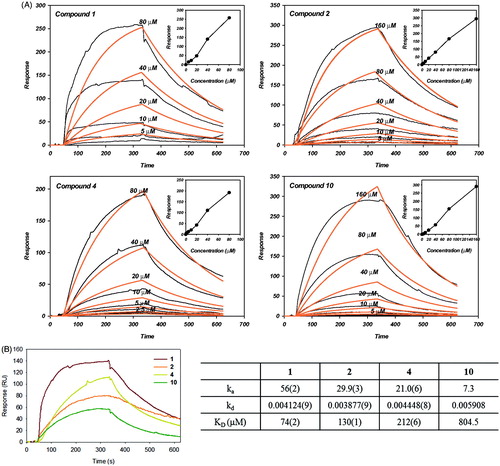
Figure 5. Surface plasmon resonance analysis for the interaction of compounds with SARS-CoV PLpro (A) Normalized refractive index change obtained for different compounds (1, 2, 4 and 10) concentrations. The experiments were carried out in PBS at a 30 μL/mL flow rate. (insert) The linear dependence of the response in function of the concentration of compounds injected over immobilized SARS-CoV PLpro support the idea of nonspecific direct binding. (B) SPR sensogram of the interaction between compounds of 40 μM and SARS-CoV PLpro (left). The KD values for the binding compounds to immobilized SARS-CoV PLpro. ka and kd from where KD were calculated are also shown (right).