Figures & data
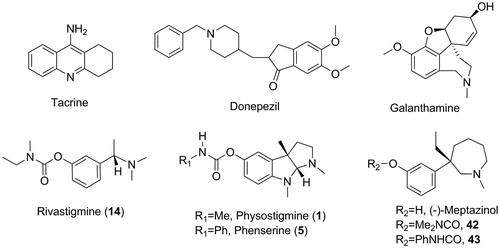
Figure 1. Structures of AChE inhibitor anti-AD drugs, classical carbamate-type AChE inhibitors and (−)-meptazinol carbamates.
Scheme 1. The process of AChE carbamoylation and decarbamoylation.aaEH is the free enzyme, AB is the inhibitor, EH · · · AB is the non-covalent complex and EA is the carbamylated enzyme. ki is inhibit constant and k3 is dissociation constant.
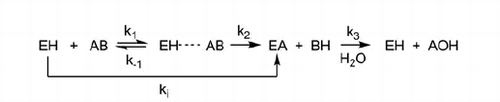
Table 1. Structures of training set molecules (1–25), their experimental IC50s reported in the literature, and estimated IC50s based on fit values to the pharmacophore model.Table Footnotea
Figure 2. Details of the best pharmacophore model (a, b) and mapping of representative training set compounds to the pharmacophore model (c, d, e, f). (a) Spatial disposition of the pharmacophoric features. Hydrogen bond acceptor (HBA, green), ring aromatic (RA, orange), positive ionizable (PI, red), hydrophobic (HYD, cyan) and excluded volume (Xvol, gray). Weights: HBA_1 (3.18); HYD_2 (1.39); HYD_3 (2.58); PI_4 (1.99); RA_5 (1.99). (b) Distances between feature centers. (c) Mapping of the most active compound (15, IC50 8 nM); (d) Mapping of the least active compound (25, IC50 40000 nM); (e) Mapping of an eutomer (3aS)-(−)-physostigmine (1, IC50 28 nM); (f) Mapping of a distomer (3aR)-(+)-physostigmine (2, IC50 9900 nM). Dark-colored (dark green, dark blue, and brown) spheres indicate unmatched features.
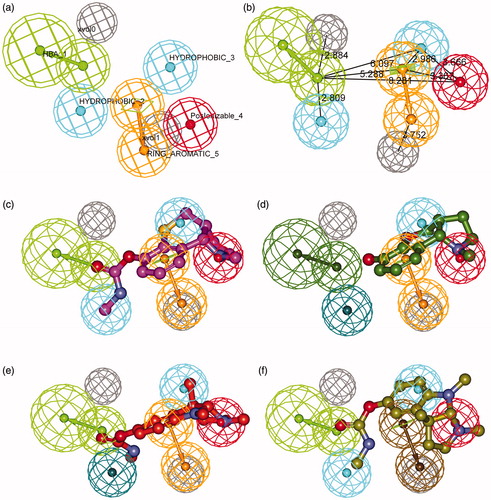
Table 2. Estimated IC50s of the test set compounds (26–41) compared with their experimental IC50s reported in the literature to validate the pharmacophore model.Table Footnotea
Figure 3. (a) Structures of (−)-bisnorcymserine and (−)-bisnoreseroline; (b) Superimposition of the crystal (−)-bisnoreseroline structure (light green, in big-ball-and-stick) on the pharmacophoric (−)-bisnorphysostigmine (3, magenta, in ball-and-stick) conformation; (c) The pharmacophore model fitted into the active site of AChE (PDB code 3ZV7). (Pharmacophoric features: green, HBA; orange, RA; red, PI; cyan, HYD; gray, Xvol; Active site residues were shown as gray lines; Key residues mapped to the excluded volumes were highlighted as yellow sticks.)
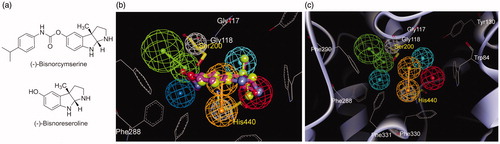
Figure 4. 2D structures of phenserine (a) and (−)-meptazinol phenylcarbamate (b) with color backgrounds highlighting common chemical features, and 3D overlays of phenserine (c, yellow, in ball-and-stick) and (−)-meptazinol phenylcarbamate (d, green, in stick) with the best pharmacophore model. (Pharmacophoric features: green, HBA; orange, RA; red, PI; cyan, HYD; gray, Xvol.)
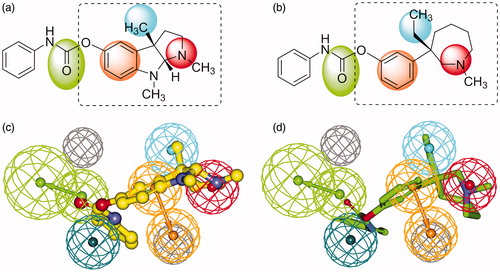
Table 3. Predicted AChE inhibitory activities of 42, 43 and (−)-meptazinol by BEST and CAESAR algorithms.
Table 4. AChE and BChE inhibitory activities, selectivity and acute toxicity of (−)-meptazinol carbamates, compared with classical carbamate-type AChE inhibitors.
Scheme 2. Synthesis of 42 and 43.a
aReagents and conditions: (i) Me2NCOCl, NaH, dry THF, 0 °C to rt, 2 h, 100%; (ii) PhNCO, Na, dry Et2O, rt, 3 h, 72%
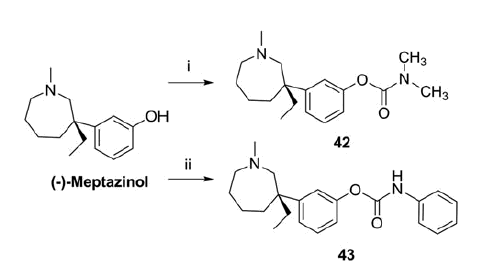
Table 5. Km and Vmax values of 42 and 43 on rHuAChE.
Figure 5. AChE-CIM-IMER time-dependent carbamoylation (inhibitors in buffer A) and decarbamoylation (buffer A as mobile phase) of AChE by 42 (50 nM) and 43 (50 nM). The percent of inhibition measured is equal to the percent of carbamylated enzyme. The curve was fitted to Perola’s mathematical equationCitation43.
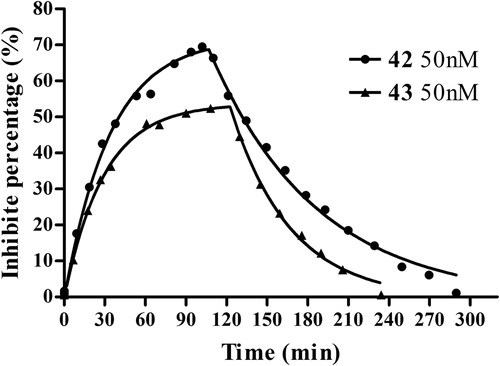
Table 6. Kinetic constants of 42 and 43 on rHuAChE (Mean ± SD, n = 6).
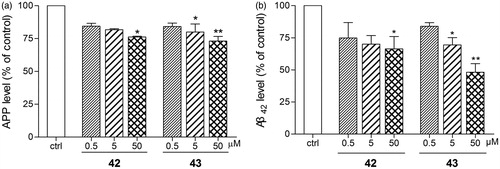
Figure 6. Anti-amyloidogenic properties of 42 and 43 were evaluated in SH-SY5Y-APP695 cells. 42 and 43 (0.5, 5 or 50 µM) were applied to SH-SY5Y-APP695 for 16 h incubated at 37 °C in 5% CO2. The cells and the culture medium were prepared to immunofluorescence and ELISA assay, respectively. (a) 42 and 43 mediated APP levels examined by immunofluorescence assay on KineticScan HCS System. (b) 42 and 43 mediated Aβ42 levels examined by ELISA assay with Human/Rat β-Amyloid (42) ELISA Kit Wako. The values are the mean ± SEM of three independent measurements. *p < 0.05, **p < 0.01 significant difference from untreated SH-SY5Y-APP695.