Figures & data
Figure 1. Chemical structures of the selected candidates and their GSK-3 inhibition features.
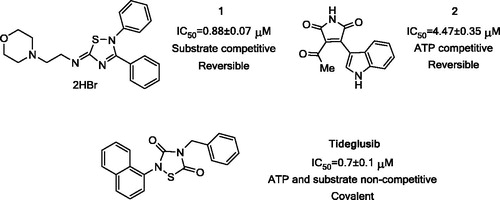
Figure 2. Organotypic culture design. (A) The retinas were mounted with the photoreceptors in direct contact to the Teflon disc. (B) After extraction from the eyeball, four cuts were made in the retina to facilitate attachment. Two retinas were cultured in each well.
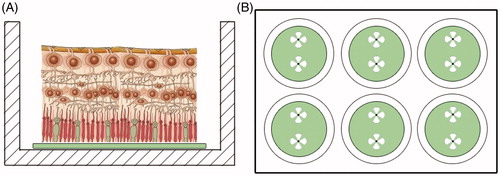
Figure 3. GSK-3 inhibitors decreased photoreceptor cell death in rd10 mouse retinal explants. Representative images of groups (A) vehicle, (B) treatment with compound 1 and (C) treatment with compound 2. D–E. Graphic representation of data: (D) mean ± standard error is represented for each experimental group. The number in brackets corresponds to the number of retinas; (E) Individual retinal values are depicted. Significances were calculated with t student test **: p < 0.01, ***: p < 0.001.
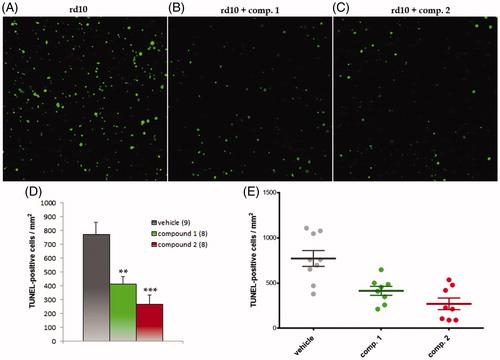
Figure 4. GSK-3 inhibitors decreased NMDA-induced retinal ganglion cell death. Representative images of groups (A) NMDA, (B) NMDA + compound 1 and (C) NMDA + compound 2. D–E. Graphic representation of data: (D) mean ± standard error is represented for each experimental group. The number in brackets corresponds to the number of retinas; (E) Individual retinal values are depicted. Significances were calculated with t student test *: p < 0.05, **: p < 0.01.
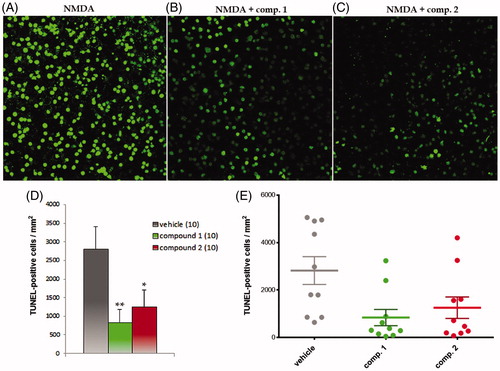
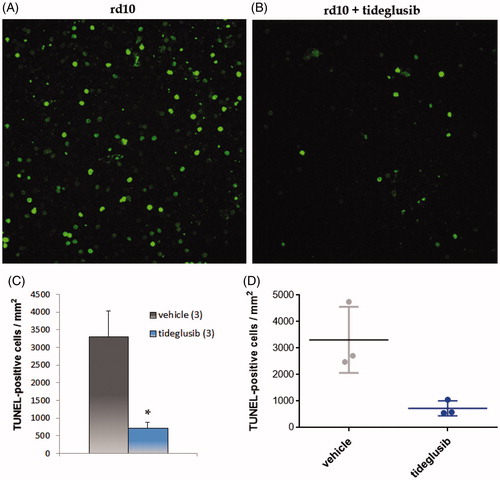
Figure 5. Tideglusib decreased photoreceptor cell death in rd10 mouse retinal explants. Representative images of groups (A) vehicle, (B) tideglusib. C–D. Graphic representation of data: (C) mean ± standard error is represented for each experimental group. The number in brackets corresponds to the number of retinas; (D) Individual retinal values are depicted. Significances were calculated with t student test *: p < 0.05.