Figures & data
Figure 1. Chemotaxonomic classification of ascidian using mass spectral variables. Species SP: Styela plicata; AM: Ascidia mentula.
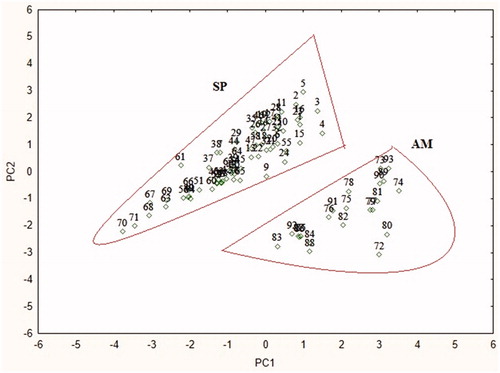
Figure 2. PCA demonstrating the clustering of chemical groups of known metabolites.
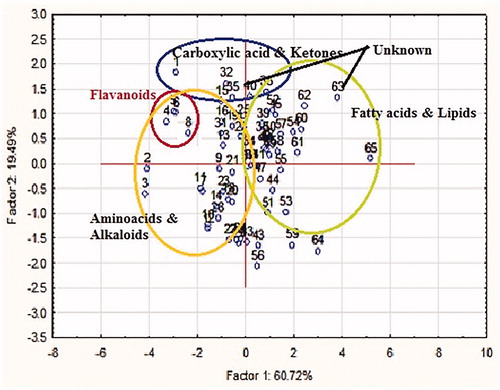
Figure 3. PLS-DA scores plot demonstrating the clustering pattern of Styela plicata metabolites with known biological potencies.
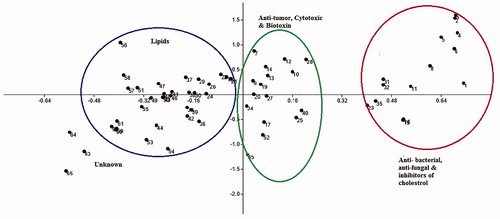
Table 1. Antitumor activity of methanol extracts of ascidians in four tumor cell lines determined by MTT assay.
Figure 4. Cytotoxicity of ascidian crude extracts against HeLa cells. Analysis of cell viability by MTT assay using CE of Styela plicata () and Ascidia mentula () at concentrations ranging from 1 to 100 μM for 24–96 h. The results represents the mean ± SEM of replicates. One-way ANOVA were calculated between contol and treated cells. *p < 0.05, **p < 0.01.
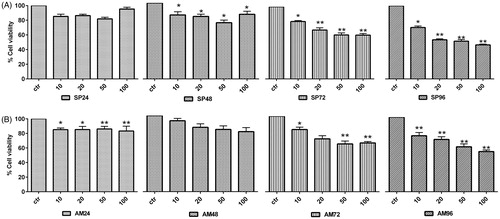
Figure 5. Dose-dependent cytotoxicity of fraction SP-50 of ascidian S. plicata against tumor and normal cells. Analysis of cell viability by MTT assay against normal BJ-EHLT (A) and four tumor (B–E) cell lines exposed to SP-50 at concentrations ranging from 1 to 50 μM for 24–96 h. The results represents the mean ± SEM of replicates. One-way ANOVA were calculated between contol and treated cells. *p < 0.05, **p < 0.01.
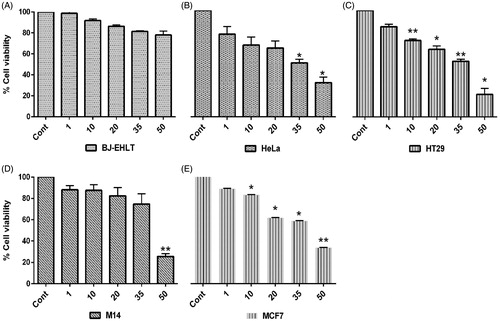
Table 2. Antitumor activity of S. plicata fractions by MTT assay.
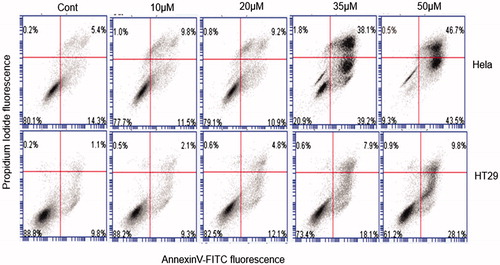
Figure 6. Flow cytometric analysis of apoptotic cells by annexin V/propidium iodide staining in HeLa and HT29 cells untreated or treated for 24 h with at the indicated concentrations. A representative experiment is shown. Annexin V+/PI − and annexin V+/PI+-stained cells were considered early apoptotic and late apoptotic or necrotic cells, respectively. Percentage of the different population of stained cells is shown.