Figures & data
Table 1. Sample composition (in bold: selected formulations).
Table 2. Sample characterization.
Figure 1. SAXS intensity spectra for Tw20 (left panel) and TW20-GLY (right panel) based systems, at pH 7.4, vertically shifted for enhanced visibility. From bottom to top: unloaded (black), loaded with 5% ibuprofen, loaded with 5% lidocaine. Dash lines decrease with q−2 behavior, typical for bilayer structures.
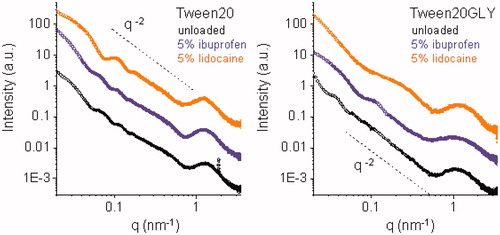
Figure 2. Release profiles of IBU and LID from the vesicular carriers in HEPES (pH =7.4) at 32 °C as a function of time: (A) TW20 samples; (B) TW2–0GLY samples. Release experiments were carried out in triplicate. The reported value represents mean values and lay within 10% of the mean.
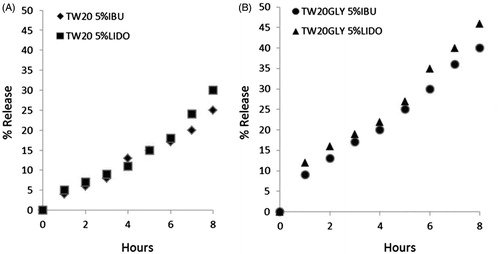
Figure 3. Cytotoxic effects of TW20 and TW20-GLY on Balb-3T3 cells as evaluated by CFE assay. Cells were exposed to increasing concentrations (0.1–100 μM) of Tw20 formulation and to the same concentration of Tween 20 control for 2 h (A) and 24 h (B) and to increasing concentrations (0.1–100 μM) of TW20GLY formulation and of Tween-20 glycine control not in vesicular form for 2 h (C) and for 24 h (d). In this range of concentrations, statistically significant cytotoxicity was found in Balb/3T3 cells exposed for 24 h to Tween-20 control at 50 μM and 100 μM (***p < 0.0001) but not to the Tw20 vesicles at the same concentrations. Statistically significant cytotoxicity was also found in cells exposed to Tw20GLY formulation at 50 μM (**p < 0.001) and 100 μM (***p < 0.0001) but not to the Tween-20 glycine control at the same concentrations.
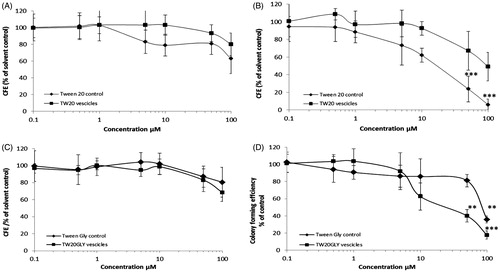
Figure 4. Cytotoxic effects of TW20 and TW-20GLY on HaCaT cells evaluated by CFE assay. HaCaT cells were exposed to increasing concentration of TW20 formulation and to the same concentration of Tween-20 control for 2 h (A) and 4 h (B) and to increasing concentrations (0.1–100 μM) of TW20-GLY formulation and of Tween-20 glycine control for 2 h (C) and for 24 h (d). In this range of concentrations, statistically significant cytotoxicity was observed only in HaCat cells exposed to TW20 formulation at 50 and 100 μM (**p < 0.001).
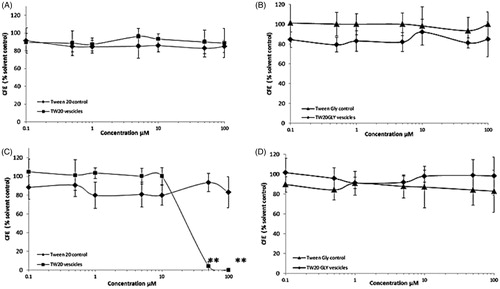
Figure 5. In vivo effects of drug-loaded nonionic surfactant vesicles on formalin-induced nociception (IBU: panel A; LID: panel B). Purified formulation of vesicles and drug solution at the same drug concentration were used. The data are considered to be statistically significant for *Pb0.05, **Pb0.01 and ***Pb0.001 versus vehicle-treated animals (HEPES buffer). N = 9–10.
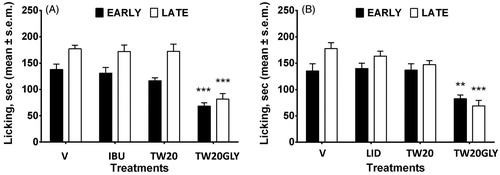
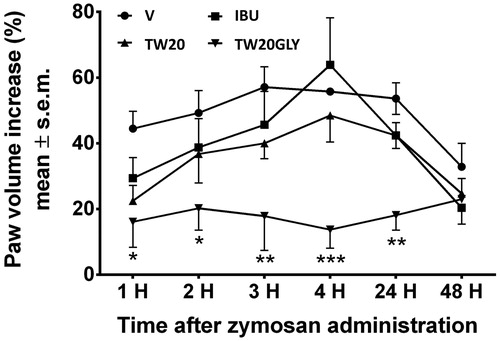
Figure 6. In vivo effects of drug-loaded vesicles in edema induced by zymosan. Purified formulation of vesicle and drug solution at the same drug concentration were used. The data are considered to be statistically significant for *Pb0.05, **Pb0.01 and ***Pb0.001 versus vehicle-treated animals (HEPES buffer). N = 10–12.