Figures & data
Figure 1. Scheme of mutual transformation of pyruvate and lactate catalyzed by lactate dehydrogenase.
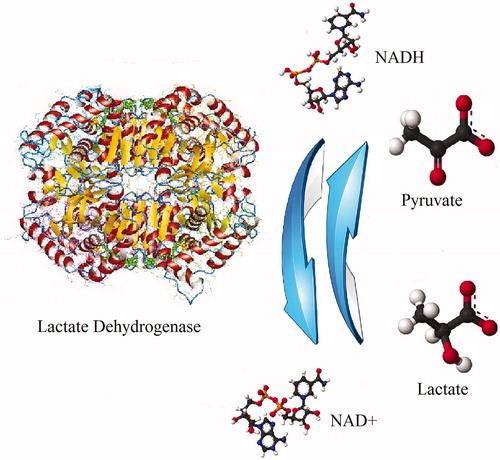
Figure 2. Structures of pyruvate and oxamate derived inhibitorsCitation37.
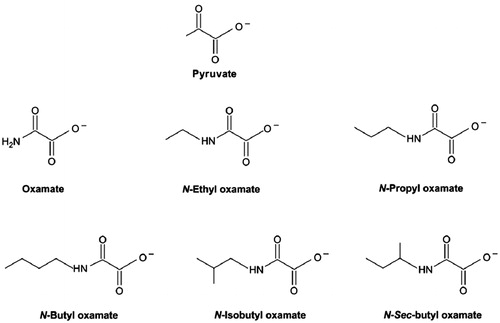
Figure 3. Sequential substrate binding and reaction processes on LDH at the coenzyme saturation condition.
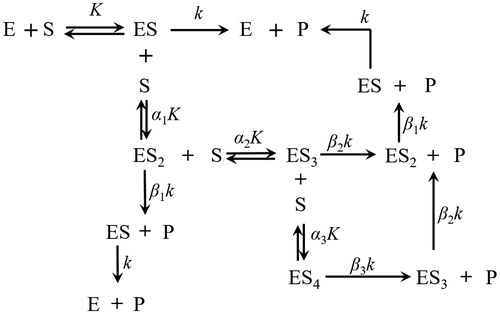
Figure 4. Typical substrate and inhibitor binding and reaction processes. (1 ≤ i, j, i + j ≤ 4). S, P, and I are the substrate, product, and competitive effector, respectively; α, β, and γ represent the kinetic constants change due to interactive effects.
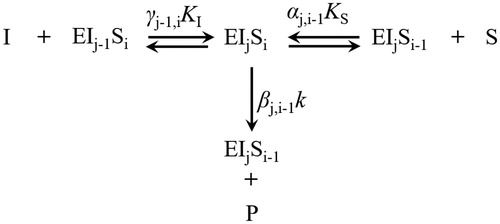
Figure 5. (A) Temperature effect on the activity of hLDH-1 with data taken from publicationsCitation23,Citation24; (B) Van’t Hoff Equation simulation of hLDH-1 K values. hLDH-1 kinetic parameters at different reaction conditions are listed in the table. The dots denote the experimental data and the lines represent the simulation results.
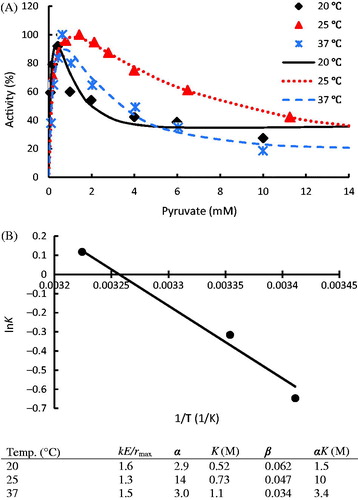
Figure 6. The initial rates of LDH from tumor human breast cells (T) and normal human breast cells (N) vary with substrate concentrations in conversion of pyruvate to lactate; The data were taken from the publicationCitation6; Kinetic parameters of different LDH isoenzymes are listed in the table. The dots denote the experimental data and the lines represent the simulation results.
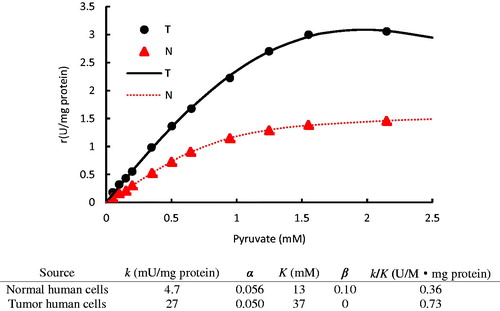
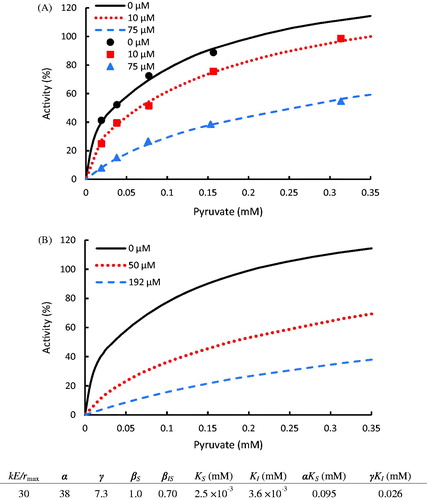
Figure 7. (A) Inhibition of N-propyl oxamate on LDH for the conversion of pyruvate to lactate with experimental data taken from the publicationCitation37. (B) Kinetic prediction of N-propyl oxamate required to inhibit LDH activity at 50 and 25% at 0.2 mM pyruvate concentration. The dots denote the experimental data and the lines represent the computing results.