
Figures & data
Figure 1. Structures of some isatin-, quinazoline- and phthalazine-based I–VI approved anticancer drugs.
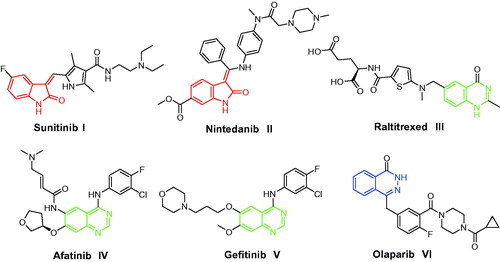
Figure 2. Structures of some reported isatins, quinazolines and phthalazines VII–XVII with anti-proliferative activity against the triple-negative breast cancer MDA-MB-231 cells, and structures of the target hybrids 5a–h, 10a–h and 13a–c.
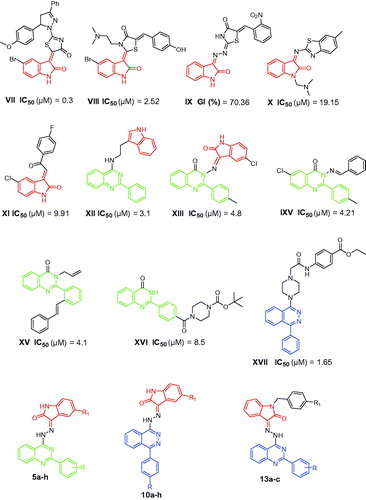
Table 1. In vitro anti-proliferative activity of the newly synthesized hybrids against MDA-MB-231 cell line.
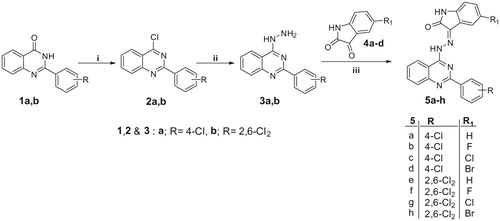
Scheme 1. Reagents and conditions: i, POCl3/N,N-dimethylaniline/reflux 6 h; ii, NH2NH2.H2O/EtOH/reflux 4 h; iii, EtOH/AcOH (catalytic)/reflux 0.5 h.
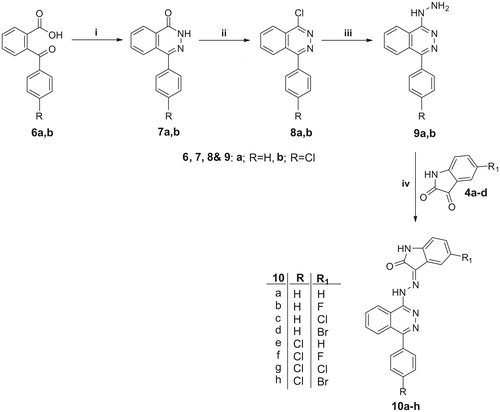
Scheme 2. Reagents and conditions: i, NH2NH2.H2SO4/NaOH/reflux 1 h; ii, POCl3/N,N-dimethylaniline/reflux 6 h; iii, NH2NH2.H2O/EtOH/reflux 7 h. iv, EtOH/AcOH (catalytic)/reflux 1 h.
Scheme 3. Reagents and conditions: i, DMF/K2CO3/reflux 3 h; ii, Compounds 4a,b/EtOH/AcOH (catalytic)/reflux 0.5 h.
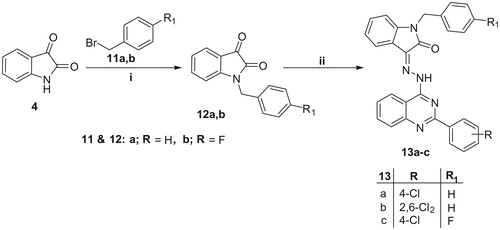
Figure 3. Effect of compounds 5e and 10g on the protein levels of A) Bax; B) Bcl-2 in MDA-MB-231 cells treated with the compounds at their IC50 concentrations against control (1% DMSO). Data are mean ± SD (n = 3). The experiment was done in triplicates. *Significantly different from control at p < 0.05. **Significantly different from control at p < 0.01. ***Significantly different from control at p < 0.001.
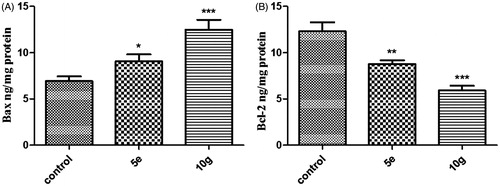
Table 2. Effect of compounds 5e and 10g on active caspase-9 and -3 levels, and the expression levels of Bcl-2 and Bax in MDA-MB-231 cancer cells treated with the compounds at their IC50 concentrations.
Figure 4. Effect of compounds 5e and 10g on the protein levels of A) active caspase-9; B) active caspase-3 in MDA-MB-231 cells treated with the compounds at their IC50 concentrations against control (1% DMSO). Data are mean ± SD (n = 3). The experiment was done in triplicates. ***Significantly different from control at p < 0.001.
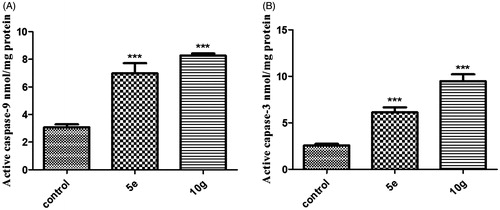
Figure 5. Effect of compounds 10g on the percentage of Annexin V-FITC-positive staining in MDA-MB-231 cells versus control (1% DMSO). Data are mean ± SD (n = 3). The experiments were done in triplicates. The four quadrants identified as: Normal, viable; Apo, early apoptotic; LATE APO, late apoptotic; NEC, necrotic. ***Significantly different from control at p < 0.001 (student’s t-test).
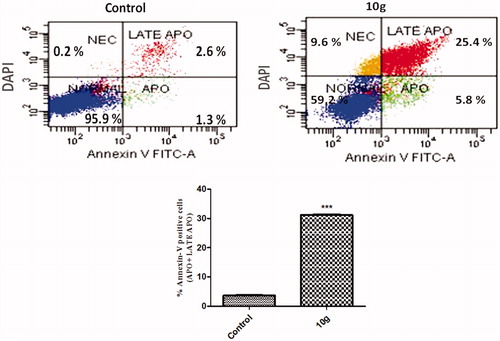
Table 3. In vitro anti-proliferative activities of the newly synthesized hybrids against A549, Caco-2, LoVo and HepG2 cell lines.
Table 4. Computer aided ADME study for the prepared hybrids.